Normal Distribution Calculator
Enter the raw score, mean, and standard deviation to find the probability of getting a number above or below that score using the normal distribution calculator below.
Results: Probabilities
| P(X ≤ x): | |
|---|---|
| P(X > x): | |
| P(X ≤ -x ∪ X ≥ x): | |
| P(-x ≤ X ≤ x): |
On this page:
- Calculator
- How to Find a Normal Distribution
- Standard Normal Distributions
- Normal Distribution Formula
- Cumulative Distribution Function Formula
- How to Find the Z-Score
- How to Find the Cumulative Probability
- Key Properties of a Normal Distribution
- Central Limit Theorem
- The Empirical Rule
- Frequently Asked Questions
- References

Joe is the creator of Inch Calculator and has over 20 years of experience in engineering and construction. He holds several degrees and certifications.


How to Find a Normal Distribution
A normal distribution, also referred to as a Gaussian distribution, is a continuous probability distribution that is symmetric about the mean.[1] Most of the observations in the sample cluster around a central peak and then taper off away from the mean equally on both sides.
An ideal normal distribution would be perfectly symmetrical and shaped like a bell, which is why its graph is often referred to as a bell curve. However, it is rare for real-life data to perfectly follow an ideal normal distribution.

In some cases, a normal distribution is not likely due to sample size limitations or skewness in the data set. Data that does not follow a normal distribution are called non-normal data.[2]
While a normal distribution is one of the most common probability distributions in statistics, there are also other non-normal probability distributions, such as the binomial distribution or Poisson distribution.
All normal distributions are symmetrical, but the exact shape of the bell curve is defined by two parameters of the data: the mean and standard deviation.
Standard Normal Distributions
A standard normal distribution, sometimes called a z-distribution, is a special normal distribution that has a mean equal to zero and a standard deviation equal to 1. You can “standardize” any normal data by subtracting the mean from all values (demeaning) and dividing by the standard deviation (rescaling). Doing this effectively transforms the data points into a set of z-scores.
Converting a normal distribution to a standard normal distribution allows comparing scores on distributions that have different means and standard deviations. It also allows you to normalize scores for decision-making purposes.
Finding the area under a normal distribution bell curve is important as it allows us to calculate the probability of observing a score within a range of the distribution. The proportion of the area under the curve between two points indicates the probability that a score will fall within that range. The total area under the curve is 1.
It is not easy to calculate the area under a normal distribution curve, but many formulas and tools have been created to simplify this task.
Normal Distribution Formula
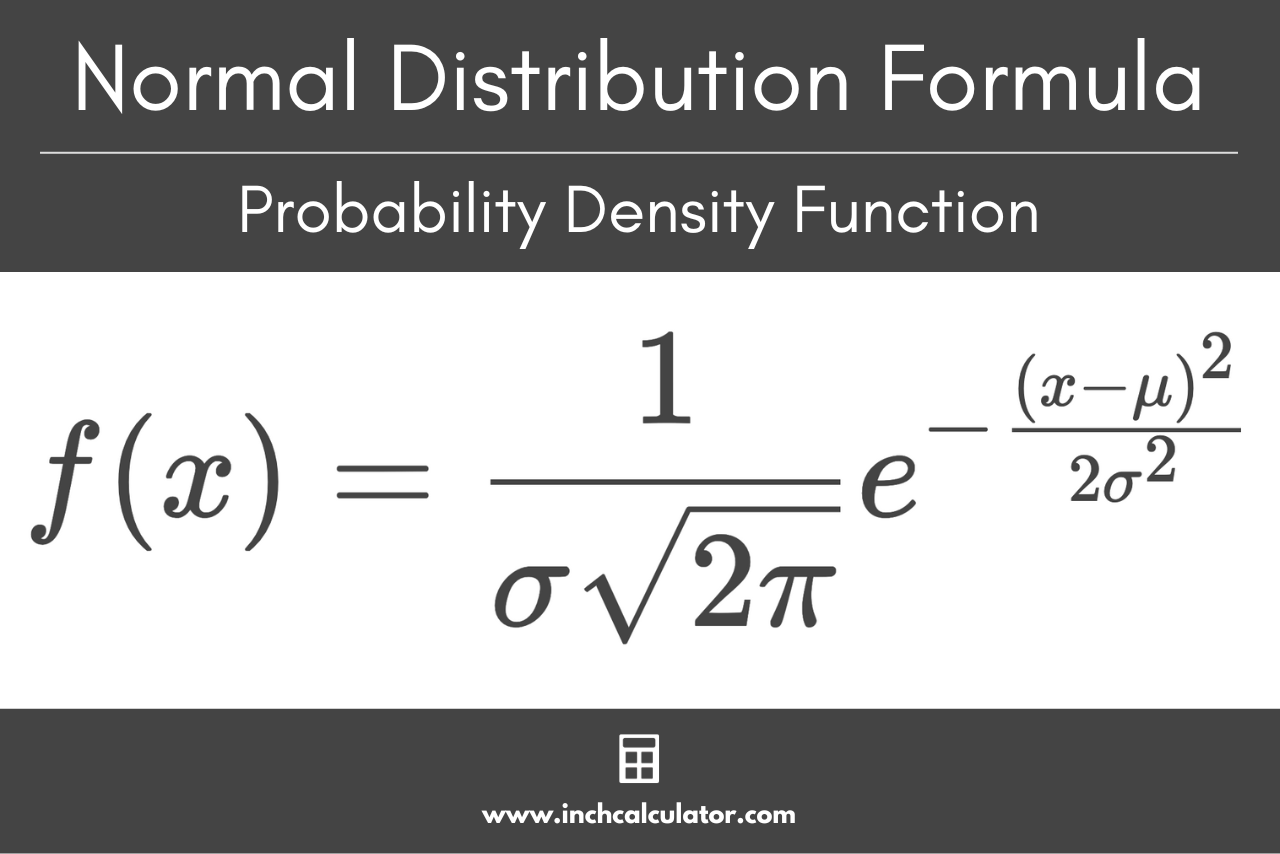
You can define the curve of a normal distribution using the probability density function using the population mean and standard deviation. The formula states that for any value of x, you can solve the probability density with the function:[3]
Where:
μ = mean
σ = standard deviation
x = random variable
Cumulative Distribution Function Formula
In every probability distribution, including normal distributions, the area under the curve is defined by a cumulative distribution function, or CDF. For a standard normal distribution, the CDF formula[4] denoted by the Greek letter phi (Φ) is:
Using this formula, you can find the probability of any value being less than a score x. More commonly, other techniques, such as using the z-score, are used to calculate this probability.
How to Find the Z-Score
To use the z-score (sometimes called a standard score) to calculate this probability, you first must find the mean and standard deviation that defines the distribution.
Then, calculate the z-score for a given raw score. You can do this using a z-score calculator or using a simple formula: z = x – μ / σ.
The z-score for a score x is equal to x minus the population mean μ, divided by the population standard deviation σ.
How to Find the Cumulative Probability
After you calculate the z-score for a given value, you can calculate the cumulative probability of a value being below the observation using spreadsheet software, a z-table, or a graphing calculator.[5]
The probability that a score is greater than or equal to the raw score is known as a p-value. Learn more about calculating p-values with our p-value calculator.
Key Properties of a Normal Distribution
A normal distribution has several key properties:
- The mean, median, and mode are all equal.
- The distribution is symmetric about the mean, so 50% of values are below it, and 50% of values are above it.
- The value of the distribution is non-zero over the entire real line, but is very close to zero for observations that are more than a few standard deviations away from the mean.
Central Limit Theorem
The central limit theorem states that as you take the mean of larger and larger samples, the sample means follow a normal distribution. In fact, this holds true even if the original population is not normally distributed, provided the sample size is large enough (generally >30 data points).[6]
This is known as the sampling distribution of the mean, which should have the same mean and variance as the original distribution divided by the sample size. This behavior is useful because it allows for much easier statistical analysis.
The Empirical Rule
The empirical rule states that 99.7% of data that is normally distributed will fall within three standard deviations of the mean, 95% of the data will fall within two standard deviations, and 68% of the data will fall within one standard deviation.
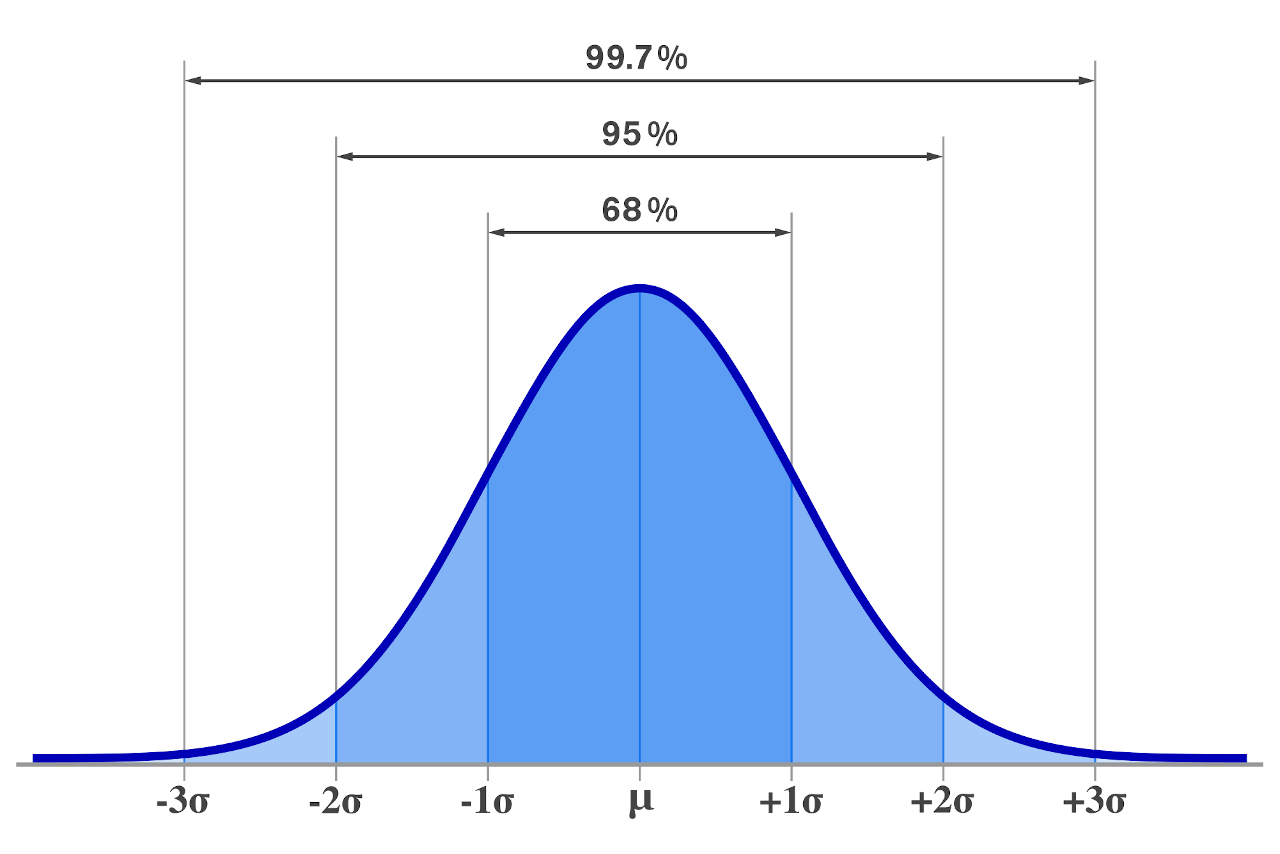
You can use our empirical rule calculator to calculate the amount of data that will fall within these intervals.
Frequently Asked Questions
What data should be normally distributed?
Data that is normally distributed should be symmetrical about the mean and observations in the sample cluster around a central peak and then taper off away from the mean equally on both sides.
What does it mean when data is not normally distributed?
Data may not be normally distributed due to sample size limitations or skewness in the data set. There may be extreme values that skew the data set, creating a non-bell-shaped curve.
Data that is not allowed to be negative may not be normal, and if the data points have sufficiently different scale, they may not be normal. Transforming the data, for example, by taking the logarithm of all values, may at times produce data that is normal when the untransformed data is not.
What is a standard normal distribution?
A standard normal distribution, sometimes called a z-distribution, is a special normal distribution that has a mean of 0 and variance (or standard deviation) equal to 1. You can take any normal distribution and standardize it by converting its values to z-scores.
Similar Statistics Calculators
References
- Chen, J, Normal Distribution, Investopedia, https://www.investopedia.com/terms/n/normaldistribution.asp
- Krithikadatta J., Normal distribution, J Conserv Dent, 2014, 17(1), 96-97. https://www.ncbi.nlm.nih.gov/pmc/articles/PMC3915399/
- Menke, W., Menke, J., Probability Density Function, Science Direct, https://www.sciencedirect.com/topics/earth-and-planetary-sciences/probability-density-function
- National Institute of Standards and Technology, 1.3.6.6.1.Normal Distribution, NIST/SEMATECH e-Handbook of Statistical Method, April, 2012, https://www.itl.nist.gov/div898/handbook/eda/section3/eda3661.htm
- Kozak, K., Finding Probabilities for the Normal Distribution, LibreTexts, https://stats.libretexts.org/Bookshelves/Introductory_Statistics/Statistics_with_Technology_2e_(Kozak)/06%3A_Continuous_Probability_Distributions/6.03%3A_Finding_Probabilities_for_the_Normal_Distribution
- LaMorte, W., Central Limit Theorem, Boston University School of Public Health, https://sphweb.bumc.bu.edu/otlt/mph-modules/bs/bs704_probability/BS704_Probability12.html