Standard Deviation Calculator
Find the standard deviation for your data set by entering the numbers in the calculator below. Keep reading to learn how to calculate standard deviation and the formula.
Results:
| Standard Deviation (σ): | |
|---|---|
| Variance (σ²): | |
| Sum of Squares (SS): | |
| Population Size (N): | |
| Mean (μ): |
Steps to Solve:
Population Standard Deviation Formula
Step One: Find the Mean
The mean is equal to the sum of each observation xi divided by the population size N.
Step Two: Find the Deviation From the Mean
The deviation from the mean for each observation is equal to its value minus the mean μ.
Step Three: Square the Deviations
Square each deviation from the mean.
Step Four: Find the Sum of Squares
Add each squared deviation to find the sum of squares.
Step Five: Find the Variance
The variance is equal to the sum of squares SS divided by the population size N.
Step Six: Calculate the Standard Deviation
The standard deviation is equal to the square root of the variance σ².
| Standard Deviation (s): | |
|---|---|
| Variance (s²): | |
| Sum of Squares (SS): | |
| Sample Size (n): | |
| Mean (x̄): |
Steps to Solve:
Sample Standard Deviation Formula
Step One: Find the Mean
The mean is equal to the sum of each observation xi divided by the sample size n
Step Two: Find the Deviation From the Mean
The deviation from the mean for each observation is equal to its value minus the mean x̄.
Step Three: Square the Deviations
Square each deviation from the mean.
Step Four: Find the Sum of Squares
Add each squared deviation to find the sum of squares.
Step Five: Find the Variance
The variance is equal to the sum of squares SS divided by the sample size n minus 1.
Step Six: Calculate the Standard Deviation
The standard deviation is equal to the square root of the variance s².
On this page:

Joe is the creator of Inch Calculator and has over 20 years of experience in engineering and construction. He holds several degrees and certifications.

Brian specializes in political science and statistics with several advanced degrees from Harvard.
How to Find the Standard Deviation
In statistics, the standard deviation is a measure of the dispersion or variability between observations in a data set or realizations of a random variable. A smaller standard deviation value indicates that the data are relatively close to the mean, while a higher value suggests that the data are more widely spread out.
Standard deviation is sometimes shortened to SD but is often represented using the symbol σ (the Greek letter sigma) or the letter s when the standard deviation is estimated from some data sample.
A low standard deviation means that the set of outcomes are close to the mean or “average” outcome. A higher standard deviation means the data is highly dispersed or that the outcomes are far-flung from one another. It is an important characteristic of a probability distribution and a foundational observation about a data set, which is used to form other observations about the data, such as the standard error, coefficient of variation, or distributions of the data.
Standard Deviation Formula
The standard deviation is equal to the square root of the variance. However, the formula to calculate the variance is different for a population versus a sample, so there are actually different formulas to calculate the standard deviation for population and sample data sets.
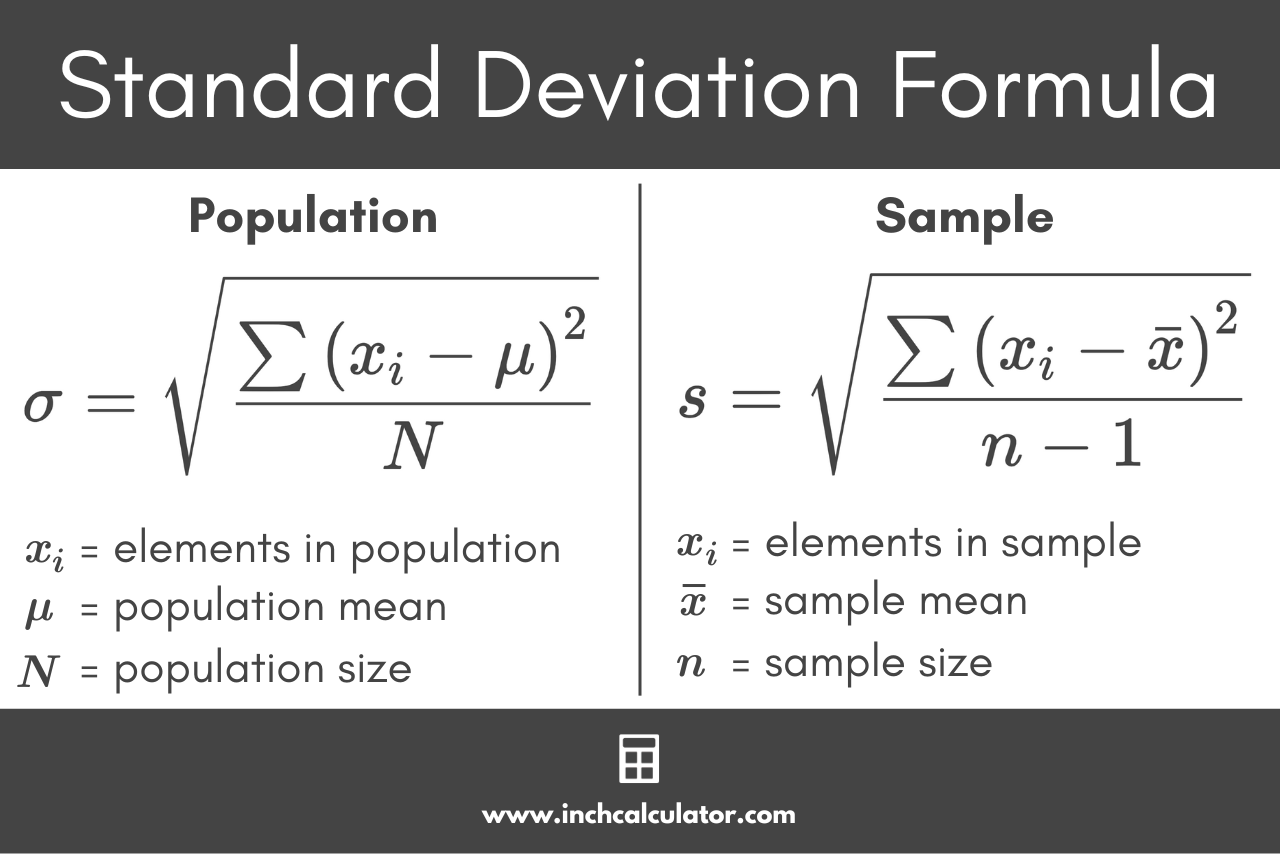
Population Standard Deviation Formula
You can calculate the population standard deviation using the following formula:[1]
Thus, the standard deviation for a population σ is equal to the square root of the sum of squares ∑(xi – μ)² divided by the population size N.
Sample Standard Deviation Formula
You can calculate a sample standard deviation using the following formula:[2]
Thus, the standard deviation for a sample s is equal to the square root of the sum of squares ∑(xi – x̄)² divided by the sample size n minus 1.
One thing you might notice that’s different in these formulas is that the standard deviation for a sample divides the sum of squares by n – 1 rather than N. The reason for this is that when working with a sample, the population variance is a biased estimator of the underlying distribution’s true variance; in particular, the estimates of variance and standard deviation that it tends to produce are, on average, too small.
This happens because, typically, you are estimating the mean of the distribution at the same time as you are estimating the variance, and as a result, there is actually a little bit of extra uncertainty the population formula does not account for.
Instead of estimating a value with an equation that has n degrees of freedom, you actually only have n – 1 degrees of freedom, which is why the sample variance formula needs to be corrected in this fashion to produce an unbiased estimator of the variance.
This is known as Bessel’s Correction.[3] Bessel’s Correction is more useful for smaller sample sizes, but for large sample sizes that approach the population size, it’s less necessary.
Steps to Calculate the Standard Deviation
We can break down the formulas above to find the standard deviation into six easy steps.[4]
Step One: Calculate the Mean
The first step to finding the standard deviation is to find the mean for the sample or population.
To calculate the mean, sum each observation in the dataset, then divide the result by the sample size or population size.
More formally, the mean formula looks more like this:
The mean is equal to the sum of each observation xi divided by the total number of observations N.
Step Two: Calculate the Deviations From the Mean
The next step is to find the deviation from the mean for each value in the data set. The formula below illustrates this:
Step Three: Square Each Deviation
Then, for each deviation from the mean, calculate its square.
Step Four: Calculate the Sum of Squares
The next step is to find the sum of squares. You can use the sum of squares formula to calculate it.
The sum of squares SS is equal to the sum of the deviations of each value from the mean, squared.
Step Five: Calculate the Variance
Next, using the sum of squares, it’s time to calculate the variance in the data. The formula to calculate the variance for a population and sample is slightly different:
Variance for a Population
The variance for a population is equal to the sum of squares divided by the population size.
Variance for a Sample
The variance for a sample is equal to the sum of squares divided by the sample size minus one, or rather, the sum of squares divided by the degrees of freedom.
Step Six: Calculate the Standard Deviation
Finally, using the variance, you can calculate the standard deviation.
Standard Deviation for a Population
Standard Deviation for a Sample
Thus, the standard deviation is equal to the square root of the variance.
For example, let’s calculate the standard deviation for the sample data [1,3,4,7,8,9].
We’ll use the six steps for the SD calculation shown above.
Step One: Find the mean by adding the values together, then dividing by the sample size.
Step Two: Find the deviations from the mean by subtracting the mean from each sample observation.
| Observation | Deviation from x̄ |
|---|---|
| 1 | 1 – 5.33 = -4.33 |
| 3 | 3 – 5.33 = -2.33 |
| 4 | 4 – 5.33 = -1.33 |
| 7 | 7 – 5.33 = 1.67 |
| 8 | 8 – 5.33 = 2.67 |
| 9 | 9 – 5.33 = 3.67 |
Step Three: Square the deviations from the mean by raising each deviation to the power of 2.
| Deviation | Squared Deviation |
|---|---|
| -4.33 | -4.33² = 18.78 |
| -2.33 | -2.33² = 5.44 |
| -1.33 | -1.33² = 1.78 |
| 1.67 | 1.67² = 2.78 |
| 2.67 | 2.67² = 7.11 |
| 3.67 | 3.67² = 13.44 |
Step Four: Find the sum of squares by adding the squared deviations together.
Step Five: Find the variance by dividing the sum of squares by the sample size minus 1.
Step Six: Find the SD by taking the square root of the variance.
So, for the data points in this sample, the standard deviation is equal to 2.87.
If you know the standard deviation of a set of data, then you can use the central limit theorem to calculate confidence intervals around the mean or conduct statistical hypothesis testing.
Similar Statistics Calculators
References
- NIH National Library of Medicine, Standard Deviation, https://www.nlm.nih.gov/nichsr/stats_tutorial/section2/mod8_sd.html
- Oja, M., Elementary Statistics for Behavioral and Social Sciences - 3.6: Introduction to Standard Deviations and Calculations, LibreTexts Statistics, https://stats.libretexts.org/Courses/Taft_College/PSYC_2200%3A_Elementary_Statistics_for_Behavioral_and_Social_Sciences_(Oja)/Unit_1%3A_Description/3%3A_Descriptive_Statistics/3.06%3A_Introduction_to_Standard_Deviations_and_Calculations
- Oxford College Department of Mathematics and Computer Science, Bessel's Correction, http://math.oxford.emory.edu/site/math117/besselCorrection/
- PennState Eberly College of Science, STAT 200 Elementary Statistics - Measures of Spread, https://online.stat.psu.edu/stat200/lesson/2/2.2/2.2.5