Mean Calculator
Find the mean of a dataset by entering the numbers in the calculator below.
Results:
| Mean: | |
|---|---|
| Sum: | |
| Count: |
Sorted Data:
On this page:

Joe is the creator of Inch Calculator and has over 20 years of experience in engineering and construction. He holds several degrees and certifications.

Brian specializes in political science and statistics with several advanced degrees from Harvard.
How to Find the Mean
The mean, or more technically, the arithmetic mean, is the most commonly used formula for the average of a set of numbers. The term average refers to a number that represents a set of data.
The terms mean and average are often used interchangeably, but there are different ways of calculating the mean, as we shall see below, and the median or other quantities might also occasionally be presented as the average.
In all cases, the mean is a measure of the central tendency of the group of numbers.
The mean for a sample is denoted x̄ (pronounced x-bar), and the population mean is denoted μ (Greek letter mu). It is one of the most commonly used summary statistics.
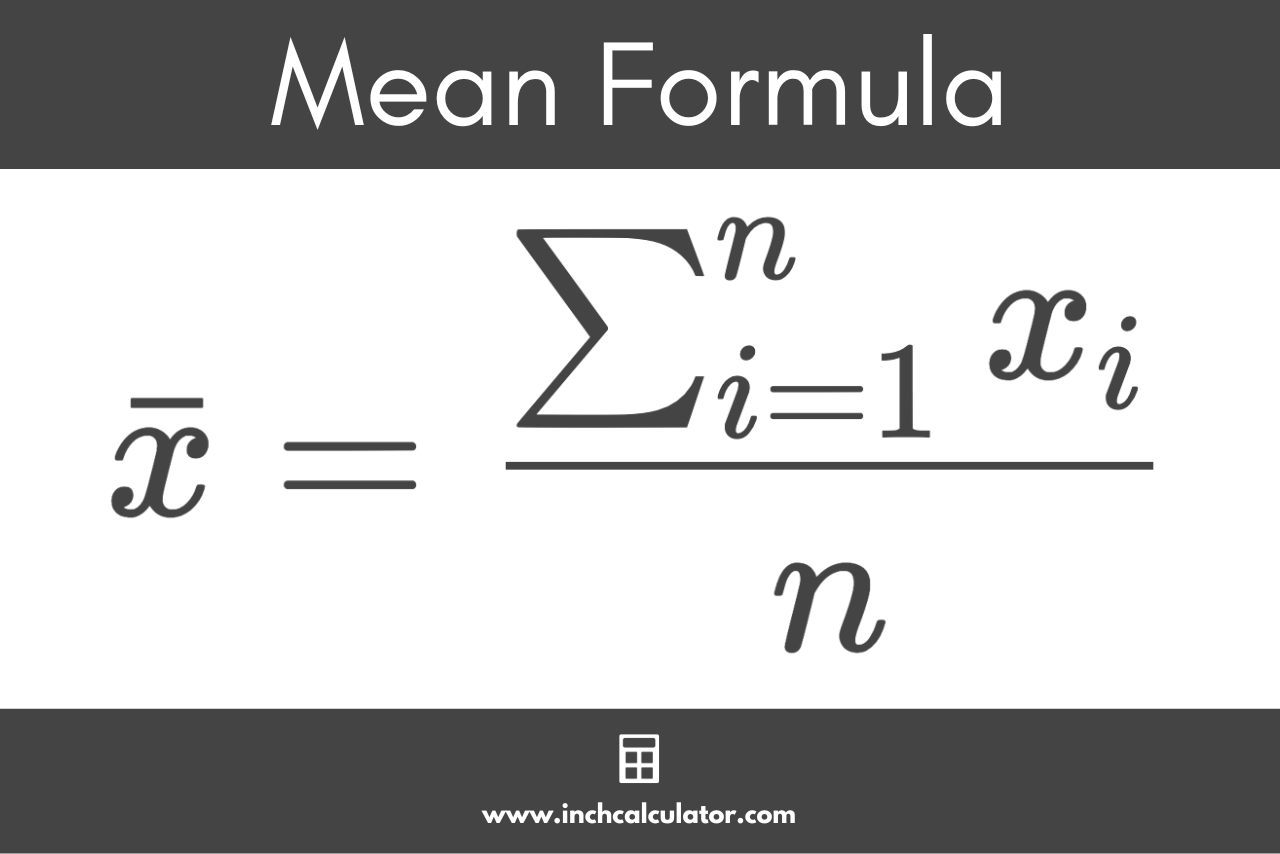
Mean Formula
You can find the mean using the following formula:[1]
Where:
xi = each number in the set
n = total number of values in the set
Thus, the mean x̄ is equal to the sum of all the numbers in the dataset divided by the count of the numbers n.
The formula to find the mean is equivalent to the following:
Or put simply:
Steps to Calculate Mean
There are three steps for calculating the mean of a dataset.
- Step 1: count the total number of values in the set
- Step 2: add up all the numbers to find the sum
- Step 3: divide the sum by the count
So, to find the mean, start by finding the number of values in the dataset, then find the sum of all of the values in the set, and finally, divide the sum by the total count of the values.
For example, let’s calculate the mean of the following numbers: [3,1,8,12,22,5]
Step 1: count the numbers.
count = 6
Step 2: add up the numbers.
sum = 3 + 1 + 8 + 12 + 22 + 5
sum = 51
Step 3: divide the sum by the count.
x̄ = 51 / 6
x̄ = 8.5
The mean x̄ of the numbers above is 8.5.
This is the process for finding the arithmetic mean, but there are several other variations of the mean to measure central tendency.
Geometric Mean
The geometric mean is another measure of the central tendency of a dataset. Instead of measuring the center using addition and division like the formulas above, it uses multiplication and the root.
If you apply the logarithm to the formula for the geometric mean, the relationship to the arithmetic mean becomes clearer. The logarithm of the geometric mean for a sample is equivalent to the arithmetic mean of the logged values. Alternatively, you can think of the geometric mean as being like an arithmetic mean on the log scale.
Geometric Mean Formula
The geometric mean x̄ can be expressed using the following formula:[2]
This is equivalent to the nth root of the product of the values in the set:
Weighted Mean
A weighted mean, sometimes called a weighted average, is an average value that reflects a different amount of importance of each value in a data. It is different from the arithmetic mean since each value contributes to the average more or less, depending on its weight.
Weighted averages receive numerous uses in statistics. For example, in order to make a survey better represent the target population, it is common to decrease the weight assigned to some individual responses and increase the weight assigned to other responses.
Weighted Mean Formula
The weighted mean x̄ can be expressed using the following formula:[3]
The weighted mean x̄ is equal to the sum of the products of each weight w and its value x, divided by the sum of the weights w.
This is a simplified representation of the formula:
Harmonic Mean
The harmonic mean is yet another measure of central tendency, and it is the reciprocal of the arithmetic mean of the reciprocals.
Harmonic Mean Formula
The harmonic mean can be expressed using the following formula:[4]
The harmonic mean x̄ is equal to the count of values in a set of n numbers, divided by the sum of the reciprocals of each value.
This is equivalent to the following simplified formula:
Mean vs. Median
We briefly touched on summary statistics above. Another common observation of numeric data used in summary statistics is the median.
The median is also a measure of the central tendency of numeric data. The median is the middle value in the dataset.
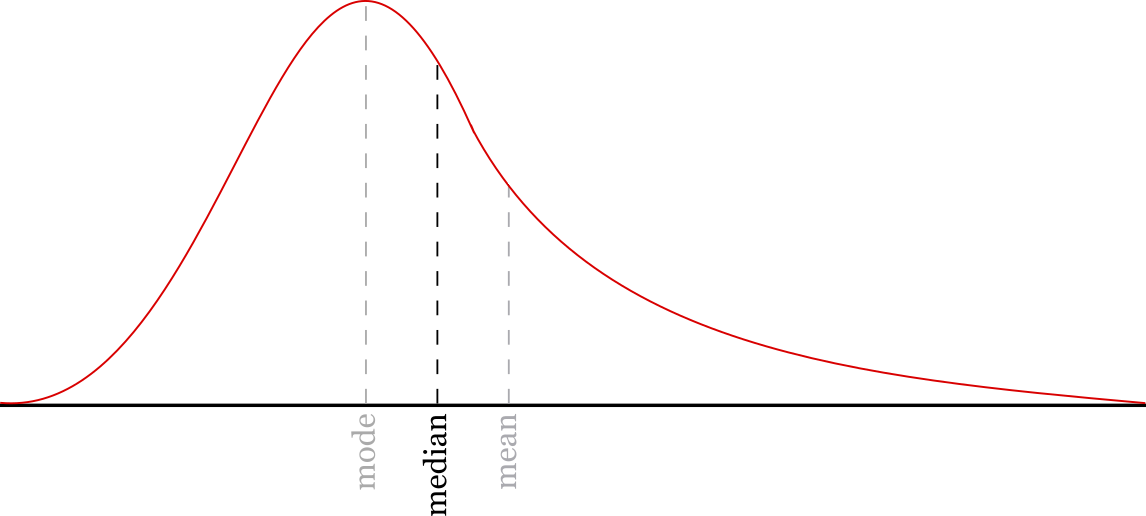
The median represents the mid-point of a number set. Half of the numbers in the set are above the median, and half are below it.
So, should you use the mean or the median to describe your data? The mean might be beneficial if the average value of the entire set of data is important.
Since the mean considers each value in the data, it might be a more accurate way to describe the central tendency of the data if the data are neither skewed to one side and there are few outliers.
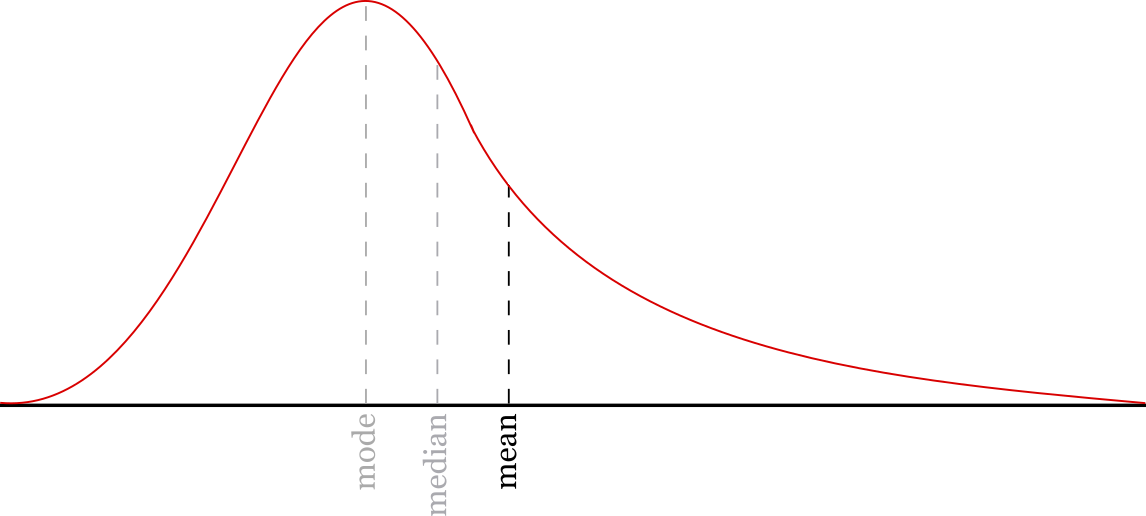
However, major outliers in the data can skew the mean in one direction. Consider the data: [1,2,3,4,75]
The average value of this data is 17, while the median value is 3.
Since the median only considers the midpoint of the data, it might do a better job of discarding those outliers and reducing the skew. However, there are some cases where outliers are sufficiently rare and also balanced between high and low values, in which case the mean might be a better representation of the data in that case.
You might also be interested in our mean, median, & mode calculator.
Frequently Asked Questions
What's a mean in math?
A mean is a measure of the location or center of the data. The most commonly used formula for the mean is the arithmetic mean, which is calculated as the sum of the data points divided by the number of data points.
When should you use the mean?
The arithmetic mean is used frequently to present a succinct summary of the typical data value. It should be used whenever the data is balanced (i.e. not skewed) and has few outliers.
In cases of skewness or where there are more than a few extremely large or extremely small values, the median may be preferred.
Why is the mean for a sample different from a population mean?
The difference in the formula for a sample mean and a population mean is subtle. Whereas a population mean covers all the values in a population, the sample mean is just for a small collection from that larger population.
Formally, the equations are often only differentiated by a capital N or a lower case n in the denominator, and mechanically, the calculations are almost identical.
Similar Statistics Calculators
References
- Holmes, A., Illowsky, B., Dean, S., Introductory Business Statistics - 2.4 Sigma Notation and Calculating the Arithmetic Mean, https://openstax.org/books/introductory-business-statistics/pages/2-4-sigma-notation-and-calculating-the-arithmetic-mean
- Statistics LibreTexts, Business Statistics - 2.5: Geometric Mean, https://stats.libretexts.org/Bookshelves/Applied_Statistics/Introductory_Business_Statistics_(OpenStax)/02%3A_Descriptive_Statistics/2.05%3A_Geometric_Mean
- Keni, D., Weighted Mean Formula, WallStreetMojo, https://www.wallstreetmojo.com/weighted-mean-formula/
- Manikandan, S., Measures of central tendency: The mean, J Pharmacol Pharmacother, 2011, Apr-Jun, 2(2), 140–142. https://www.ncbi.nlm.nih.gov/pmc/articles/PMC3127352/