Mean, Median, Mode Calculator
Find the mean, median, and mode of a data set along with other information such as the total sum, count, min, max, and range values.
Results: Summary Statistics
| Mean: | |
|---|---|
| Median: | |
| Mode: | |
| Range: | |
| Smallest: | |
| Largest: | |
| Sum: | |
| Count: |
Sorted Data:
On this page:

Joe is the creator of Inch Calculator and has over 20 years of experience in engineering and construction. He holds several degrees and certifications.

Brian specializes in political science and statistics with several advanced degrees from Harvard.
How to Calculate Mean, Median, and Mode
Mean, median, and mode are different ways to measure the center of a data set or of a probability distribution, often called the central tendency of a distribution or a data set.[1]
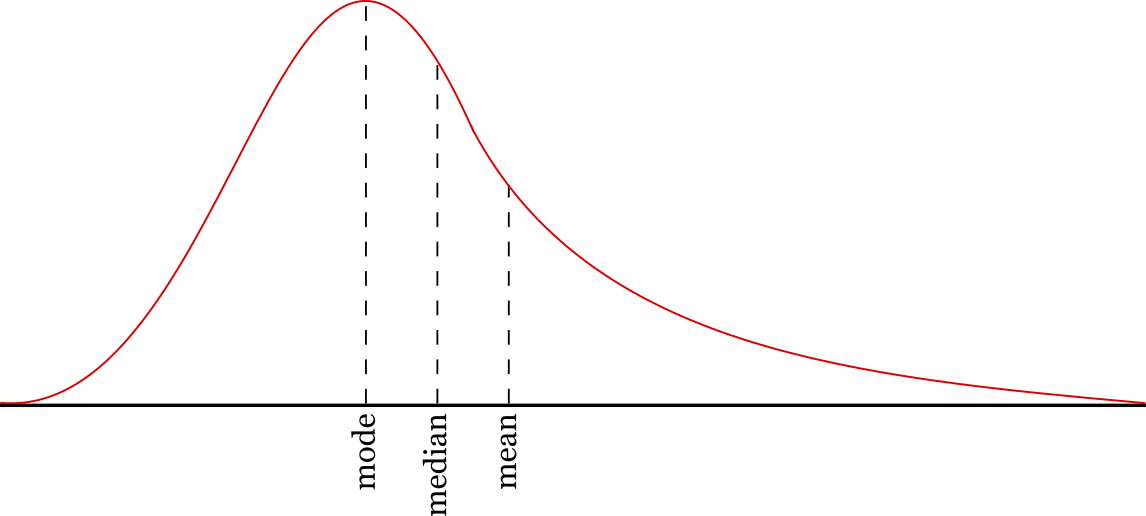
The mean is the average of the data or the expected value of a distribution, the median is the middle in the sense that there will be exactly as much data with values that are higher and lower (or realizations from that probability distribution are equally likely above and below), and the mode is the data point with the highest frequency of occurrences.
In some probability distributions, these central tendencies may all coincide. For example, the mean, median, and mode of a normal distribution are one and the same. So too with the binomial distribution. But in other distributions, these numbers may differ. For example, the graph below describes a probability distribution that highlights the differences between these statistics.
Moreover, because real data is messier than a probability distribution that comes out of a formula, a sample that seems to come from a probability distribution where these quantities should coincide will not itself have medians and means that are identical.
For example, men’s heights are often described as normally distributed, but it would be surprising if the mean and median of 100 random men were actually identical. Still, because the data is normal, and these are both measures of central tendency, these numbers should be close.
Mean, median, and mode are summary statistics, which means they provide, succinctly and, in this case, in a single number, information on a data set. They are commonly used throughout mathematics. The minimum value, maximum value, sum, count, range, and standard deviation are some other frequently used summary statistics for data sets.

How to Find the Mean of a Set of Values
In statistics, the mean is the average value of a set of numbers. It’s also referred to as the arithmetic mean. Note that there are some other types of mean that are not covered here, including the geometric mean, weighted mean, and harmonic mean.
The sample mean is denoted x̄ (x-bar) and the population mean is denoted μ (mu).
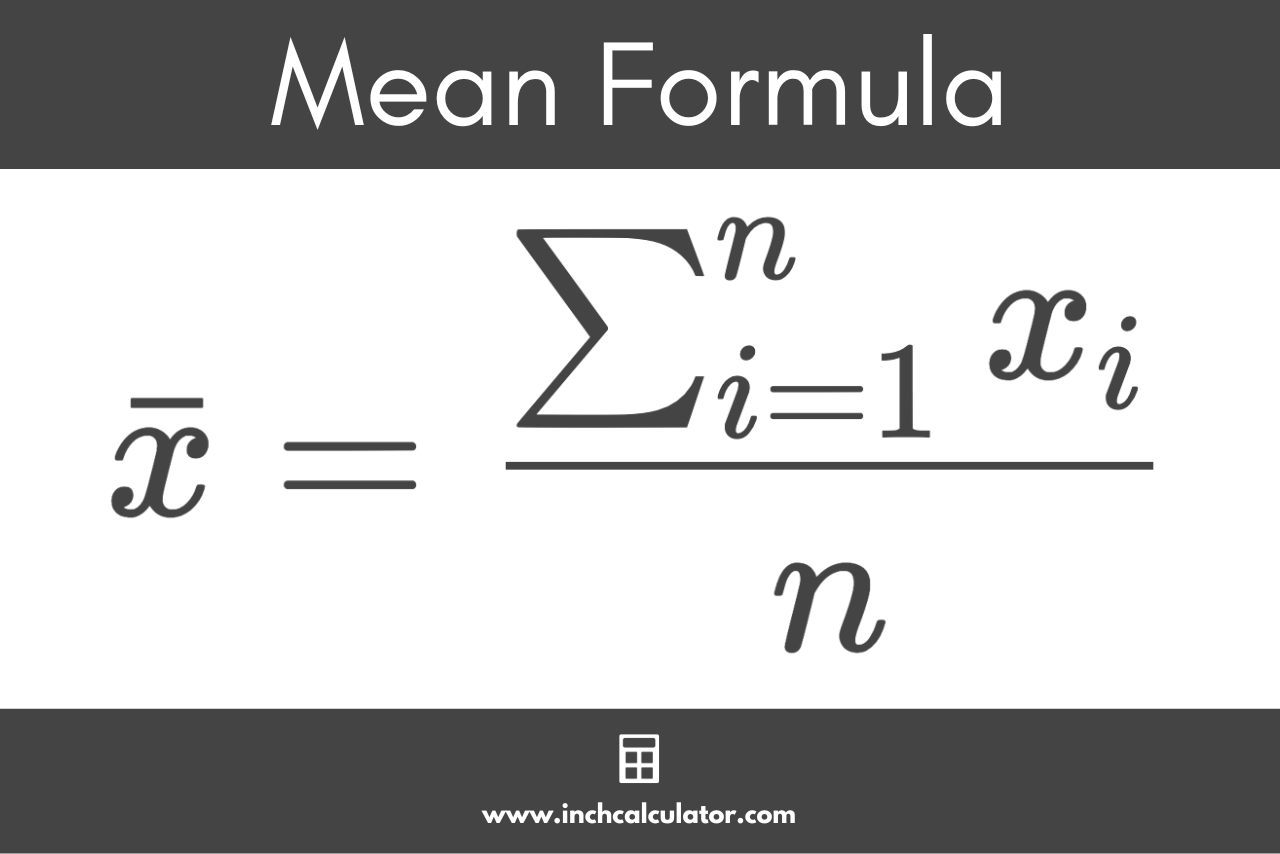
To find the mean, add up all of the numbers to find the sum, then divide the sum by the number of values in the set.
This is the mean formula:[2]
Where:
n = total number of values in the set
For example, Let’s find the mean for a given data set [1,2,3,4]
So, the mean of the set [1,2,3,4] is 2.5.
How to Find the Median
The median is the middle number in an ordered set of numbers. If the count of numbers in the set is even, then the median is the mean of the middle values.
To find the median of a data set, start by sorting the set in ascending order, and then count the values. The formula to calculate the median is different for data sets with odd and even numbers of values.
Median Formula for Datasets With Odd Numbers
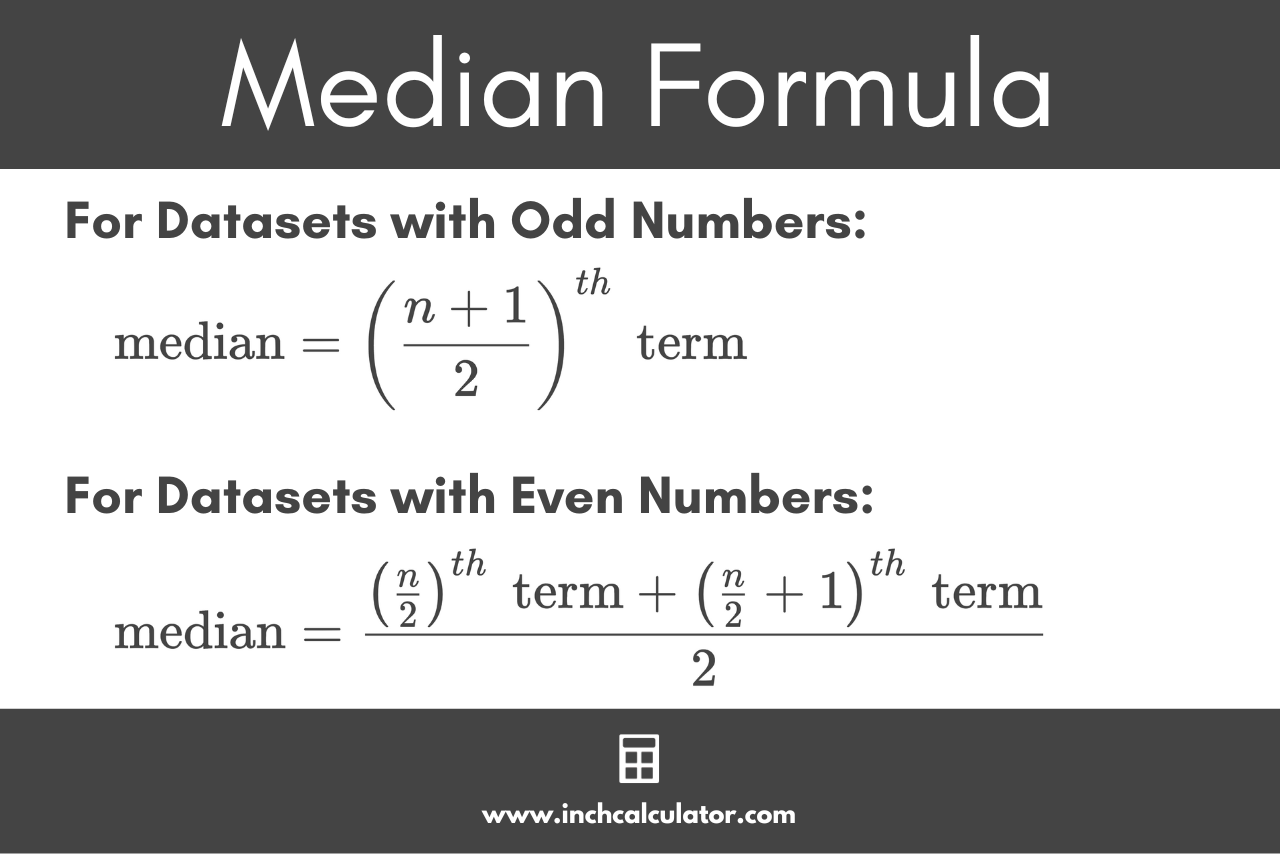
For a sorted dataset with an odd number of values, use the following median formula:
The median is equal to the (n + 1)/2th term in the dataset, which is the number at the index of the count of the data n plus 1, divided by 2. So, the median is the number exactly in the middle when the count is odd.
For example, let’s find the median for the following set containing an odd number of values [1,3,5,7,15,22,29]
So, the median is the fourth term in the set, which is 7.
Median Formula for Datasets With Even Numbers
If the count of the numbers is even, then there are often multiple numbers that could be chosen so that half the data has values greater than the median and half has values lower. But one of the more common and easy-to-remember formulas is simply to take the average of the two middle numbers.
For a sorted dataset with an even number of values, use the following median formula:
The median is equal to the n/2th term plus the (n/2) + 1th term, divided by 2.
So, to find the median, find the two numbers in the middle by dividing the count by 2 to find the lower-middle index, then adding 1 to find the upper-middle index.
Then, add the numbers at the lower and upper-middle indices and divide the result by 2. The median for an even dataset is actually the mean of the middle two values.
For example, let’s find the median for the following set of numbers [1,3,5,7,15,22,29,38]
So, the median of this even dataset is 11
How to Find the Mode
The mode is the number that occurs most frequently in a set of numbers. To find the mode, count the number of times each number in the set occurs. The number with the greatest count is the mode.
A set of data can have more than one mode if each of the modes occur the same number of times. To be a mode, the number(s) must occur at least twice.
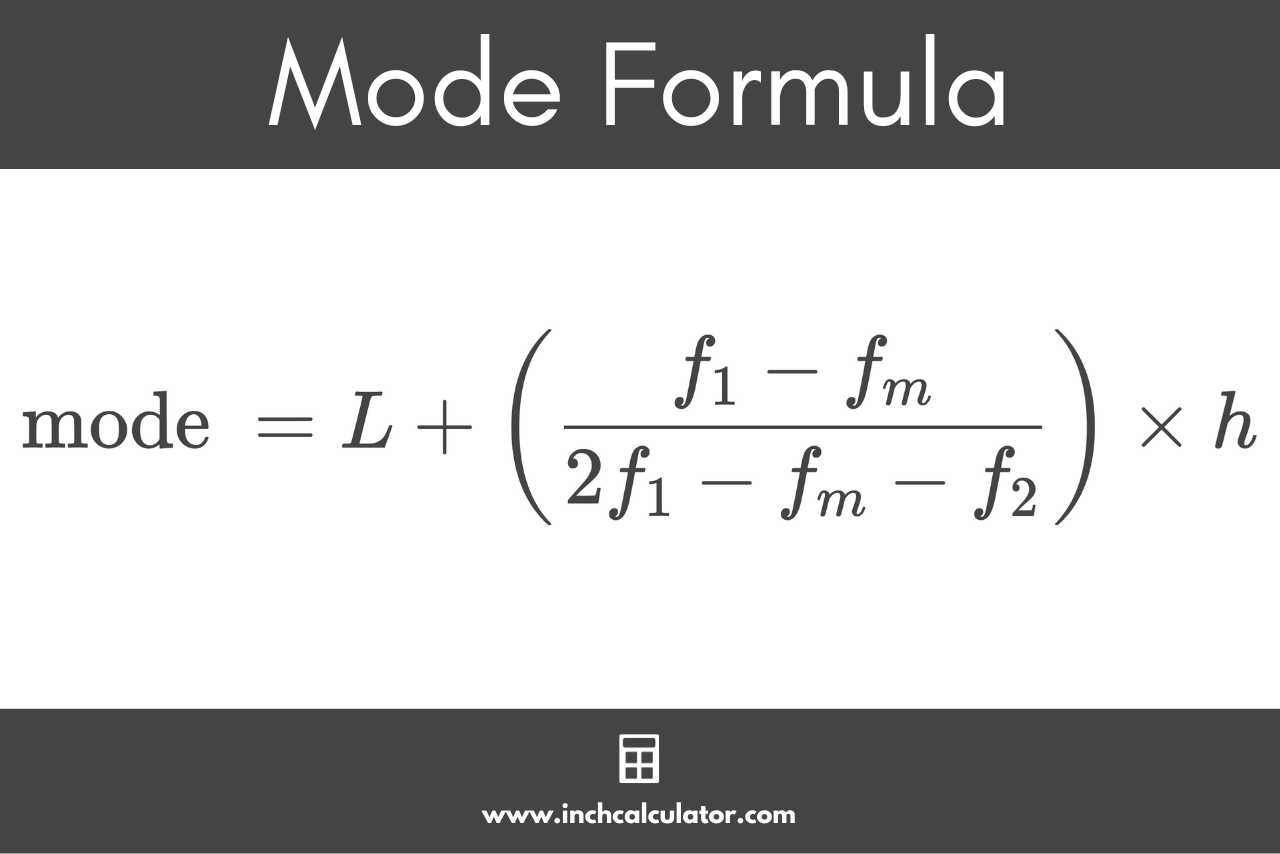
You can use the following formula to find the mode:
Where:
L = lower limit of the modal class
fm = frequency of the modal class
f1 = frequency of the class preceding the modal class
f2 = frequency of the class succeeding the modal class
h = size of the class interval
For example, let’s find the mode for the following set of numbers [1,2,2,3,5,5,7]
1 occurs one time
2 occurs two times
3 occurs one time
5 occurs two times
7 occurs one time
Since 2 and 5 occur at the highest frequency, they are the mode.
How to Find the Range
The range measures the dispersion between the numbers in the set. It is the difference between the largest and smallest number.
To calculate the range, find the largest and smallest numbers in the set, then subtract the smallest number from the largest number. You can use the range formula to find it:
For example, let’s find the range for the following set of numbers [3,7,22,54]
smallest number (min) = 3
largest number (max) = 54
Since the data spans from a minimum value of 3 to a maximum value of 54, the range is 51.
Similar Statistics Calculators
References
- US National Library of Medicine | National Institutes of Health, Measures of central tendency: Median and mode, https://www.ncbi.nlm.nih.gov/pmc/articles/PMC3157145/
- Holmes, A., Illowsky, B., Dean, S., Introductory Business Statistics - 2.4 Sigma Notation and Calculating the Arithmetic Mean, https://openstax.org/books/introductory-business-statistics/pages/2-4-sigma-notation-and-calculating-the-arithmetic-mean