T-Test Calculator
Compare the means of two samples using a single-sample or two-sample t-test below.
Results:
| Two-tailed P: | |
|---|---|
| Left-tailed P: | |
| Right-tailed P: | |
| Test Statistic (t): | |
| Degrees of Freedom (df): |
| Two-tailed P: | |
|---|---|
| Left-tailed P: | |
| Right-tailed P: | |
| Test Statistic (t): | |
| Degrees of Freedom (df): | |
| Pooled Standard Deviation: | |
| Difference of Means: | |
| Standard Error of Difference: |
On this page:

Joe is the creator of Inch Calculator and has over 20 years of experience in engineering and construction. He holds several degrees and certifications.

Brian specializes in political science and statistics with several advanced degrees from Harvard.
How to Do a T-Test
A t-test calculates how significant the difference between the means of two groups are. The results let you know if those differences could have occurred by chance, or rather, whether the difference is statistically significant.
A t-test uses the test statistic, sometimes called a t-value or t-score, the t-distribution values, and the degrees of freedom to calculate the statistical significance of the difference.
Since a t-test is a parametric test, it relies on assumptions about the process that generated the underlying data. In particular, the likelihood or unlikelihood that the t-test provides for a difference being due to chance depends on the assumption that the data are normally distributed and each data point’s values are independent of one another.
Depending on how plausible those assumptions are, the analysis that follows will be more or less useful. If your data is continuous and comes from a relatively large random sample from some population, the central limit theorem implies that these assumptions will likely be approximately satisfied.
Types of T-Tests
The first part of doing a t-test is determining which type of t-test you need to do.
There are three different types of t-tests:
- one-sample t-test: used to compare the mean of a sample to the known mean of a population
- two-sample t-test: used to compare the mean of two different independent samples
- paired t-test: used to compare the mean of two different samples after an intervention or change
How to Calculate T Using a One-Sample T-Test
A one-sample t-test, or single-sample test, is used to compare a sample mean to a population mean when the null hypothesis is that the sample mean is equal to the population mean.
Those who first encounter this test often wonder why they would use it, since the population mean is often not known (and the data is often collected to determine the population mean in the first place).
It often does make sense to use a one-sample t-test if you have a particular interest in whether a sample’s mean is different from some reference value that is determined to be substantively important for other reasons.
For example, let’s suppose that 5 micrograms of lead per liter of blood is the maximum safe amount, according to most medical references. Then, you may well consider doing a one-sample t-test to examine whether the average blood lead level of a sample of individuals was above that medically acceptable limit.
One-Sample T-Test Formula
To calculate the t value using a one-sample t-test, use the following formula:
Where:
x̄ = sample mean
μ = population mean
s = sample standard deviation
n = sample size
Thus, the test statistic t is equal to the difference between the sample mean x̄ and the population mean μ, divided by the standard error s / √n.
How to Calculate T Using a Student’s T-Test
A Student’s t-test is used for test statistics that follow a Student’s t-distribution under the null hypothesis that two populations have equal means.
The name “Student” refers to the pseudonym of the author who first proposed the test in an academic journal, and does not refer to the fact it is one of the most commonly taught tests in statistics courses (although the latter is also true).
The Student’s t-test assumes that the variances of two populations are equal and asks whether their means differ significantly.
This is a type of two-sample test used to compare two sample means, where a large t-value suggests that the samples are very different, and a small t-value suggests that they are similar.
Similar to the one-sample t-test, individuals who first encounter this test may wonder about the plausibility of its assumptions. In particular, you might question how the variances in two samples could possibly be equal if the means are different.
In some contexts (for example, the industrial experiments that motivated Student’s efforts), there might be substantive reasons to assume equal variances. More informally, if you calculate the standard deviations in each sample and sees that they are close, you might proceed to calculate Student’s t-test.
More formally, some analysts would recommend that you initially conduct an F-test to determine whether variances are different, and then proceed to consider the means. But many analysts would also simply not make the equal variances assumption and proceed directly to Welch’s t-test.
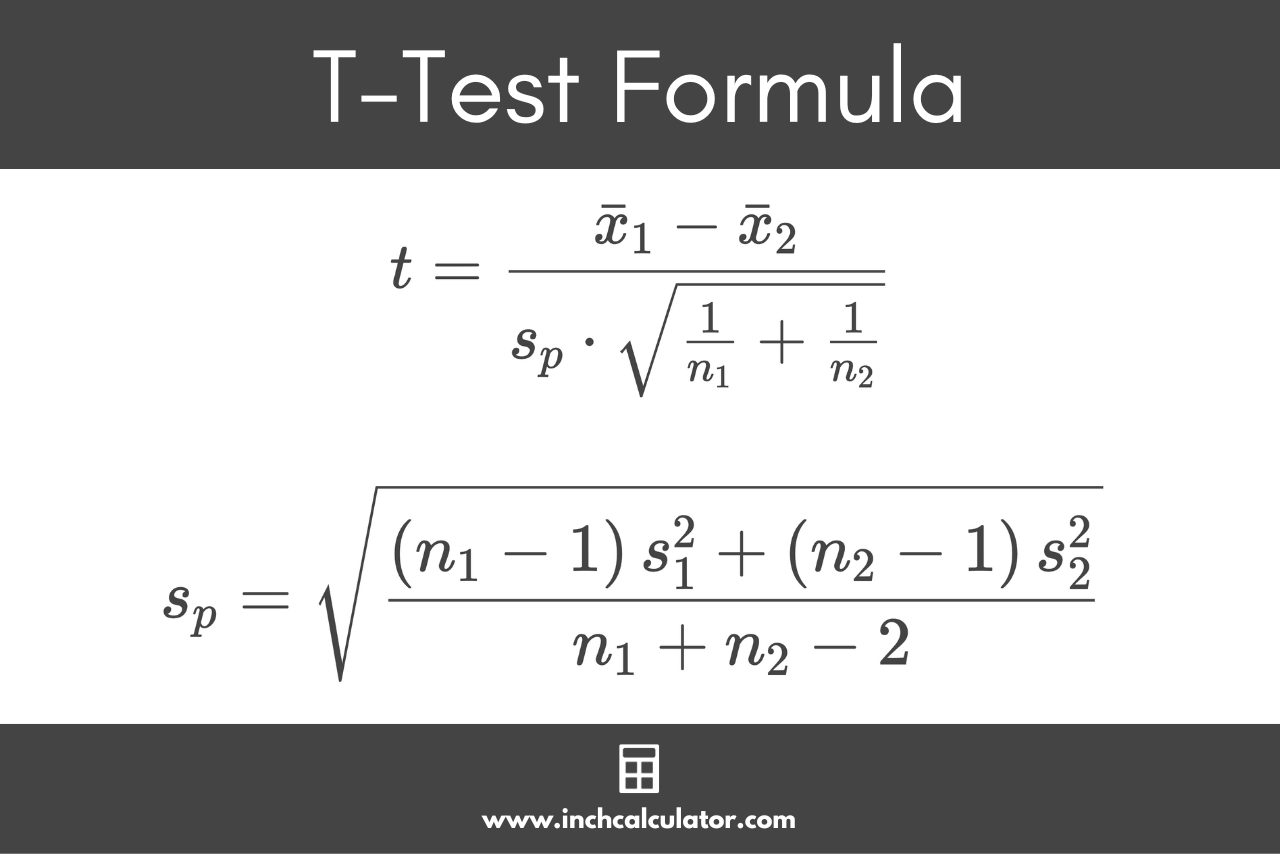
Student’s T-Test Formula
The formula for a Student’s t-test is:
Given the formula to calculate the pooled standard deviation sp:
Where:
x̄1 = first sample mean
x̄2 = second sample mean
n1 = first sample size
n2 = second sample size
s1 = first sample standard deviation
s2 = second sample standard deviation
n1 + n2 – 2 = degrees of freedom ν
In a Student’s t-test, the test statistic t is equal to the difference between sample means x̄1 and x̄2, divided by the pooled standard deviation sp times the square root of 1 divided by the first sample size n1 plus 1 divided by the second sample size n2.
The pooled standard deviation sp is equal to the first sample size n1 minus 1 times the first sample standard deviation s1 plus the second sample size n2 minus 1 times the second sample standard deviation s2, divided by the degrees of freedom, in this case the sum of the sample sizes minus two.
It is called the “pooled” standard deviation because it combines or “pools” the data between both samples to determine the overall variability of the data.
This formula can be broken down into a few simple steps.
Step One: Calculate the Degrees of Freedom
Step Two: Calculate the Pooled Standard Deviation
Step Three: Calculate the Test Statistic
How to Calculate T Using Welch’s T-Test
Recall that the Student’s t-test assumes that the variances of two populations are equal. As was mentioned above, this is often a questionable assumption, and ultimately unverifiable.
In this case, you can use Welch’s t-test, which is sometimes also called an unequal variances t-test or an “unpooled” t-test. Like before, the null hypothesis with this test is that two populations have equal means.
Welch’s T-Test Formula
The formula for Welch’s t-test is:
Degrees of Freedom Formula
To find the degrees of freedom when using Welch’s t-test, use the Satterthwaite formula:
Find the P-Value
The next step is to find the p-value for the test statistic. The p-value is a measure of how “surprising” or “unlikely” some statistic would be given the particular assumptions that the analyst makes.
In the case of these t-tests for differences in means, the p-value is the probability of calculating a t-statistic that is as large or larger than what was actually calculated from the observed data if, in fact, the population means were identical.
More generally, a p-value is used to determine whether to reject the null hypothesis. In formal hypothesis testing, you would specify beforehand the p-value that would lead you to conclude that the two samples came from different populations.
What is the Right P-Value?
These standards differ by field and disciplines a lot, for example, in social and biological sciences, a p-value of 0.05 or smaller (implying 5% or lower chance of observing the data under the null hypothesis) is common, although in some cases 0.1 or 0.01 might be the standard.
In the physical sciences, it is not uncommon to pre-specify a “6 sigma” standard for certain kinds of evidence, which requires an astronomically small p-value.
How to Calculate the P-Value
To calculate the p-value from a t-statistic, use a t-table and locate the degrees of freedom in the leftmost column. Then, locate the desired p-value in the heading row, 0.05 is most commonly used for a 95% confidence level.
Then, find the intersection of the row and column to find the critical value.
Drawing Conclusions Using the P-Value
If the calculated t-value is larger than the critical value, then you can reject the null hypothesis. If it is less than the critical value, then you fail to reject the null hypothesis.
The t-distribution is related to the normal distribution; indeed, it can be thought of as the normal distribution’s “heavy-tailed” cousin. The degrees of freedom in the t-distribution determines how heavy the tails are, with fewer degrees of freedom resulting in greater departures from normality.
As the degrees of freedom increase, it becomes harder and harder to tell the differences between the associated t-distribution and the normal distribution.
Because of this fact, experienced statistical analysts are often able to approximately estimate the p-value of a particular t-statistic through their familiarity with the normal distribution.
A t-statistic of 2 or greater is typically enough to confirm statistical significance in the social and biological contexts.