Standard Error Calculator
Find the standard error for your data set by entering the numbers in the calculator below.
Results:
| Sample Size (n): | |
|---|---|
| Standard Deviation (s): | |
| Standard Error (SE): |
Steps to Solve:
Step One: Find the Sample Size
The sample size is the count of the values in the sample.
Step Two: Find the Standard Deviation
Use the standard deviation formula to solve for s.
Step Three: Find the Standard Error
Apply the standard error formula to solve for SE.
On this page:

Joe is the creator of Inch Calculator and has over 20 years of experience in engineering and construction. He holds several degrees and certifications.

Brian specializes in political science and statistics with several advanced degrees from Harvard.
How to Find the Standard Error
The standard error refers to the standard deviation of a test statistic.[1]. A test statistic is a numerical summary of data that is used to assess some hypothesis. One of the most commonly used summaries of the data is a mean.
But there are others, for example, the variance, the maximum, or the median.
Standard error is denoted SE, and sometimes SEM since it’s also referred to as the standard error of the mean. SE is often used to calculate confidence intervals.
In sum, while both standard deviation and standard error are measures of variability, standard deviation is a measure of the dispersion of individual data values, while SE is a measure of the dispersion of the means of some samples.[2]
Why is Standard Error of the Mean Important?
Under particular assumptions about how data are generated, a test statistic can often be shown to follow a known probability distribution. Because the test statistic follows a probability distribution, one can use the test statistic to learn about how unusual a particular sample of data is given some prior assumptions.
Alternatively, one can use the standard error to predict what future outcomes are likely to be through the formation of confidence intervals.
To make this slightly more concrete, suppose one has data that comes from a normal distribution, such as individual test scores. The mean or average of a sample of normal random variables also follows a normal distribution.
Because the mean of a sample is also normal, that mean of a sample has its own mean and standard deviation, which can be calculated. Indeed, the expected value of the mean of the sample will be the same as the expected value of the underlying distribution.
However, the standard deviation of the mean of the sample will actually be smaller than the standard deviation of the underlying distribution. To distinguish these two similar-sounding quantities, analysts will use the term “standard error” in the former case.
Assuming one has the standard error, one can assess some facts about that sample. For example, one might be interested to know where the average score of some collection of students on a standardized test falls on the bell curve, assuming the mean and standard deviation of test scores were known beforehand.
Because of how frequently the mean comes up in statistical analysis, it is common to use the term standard error as a shorthand for the term standard error of the mean. Technically, this is imprecise as different test statistics have different formulas for standard error, but using the full phrase can be tiresome.
People who first come across the concept of standard error may have a hard time intuitively understanding why a different formula is necessary for standard error than for the standard deviation. The answer is that there is more variability in a single observation than the average of many observations.
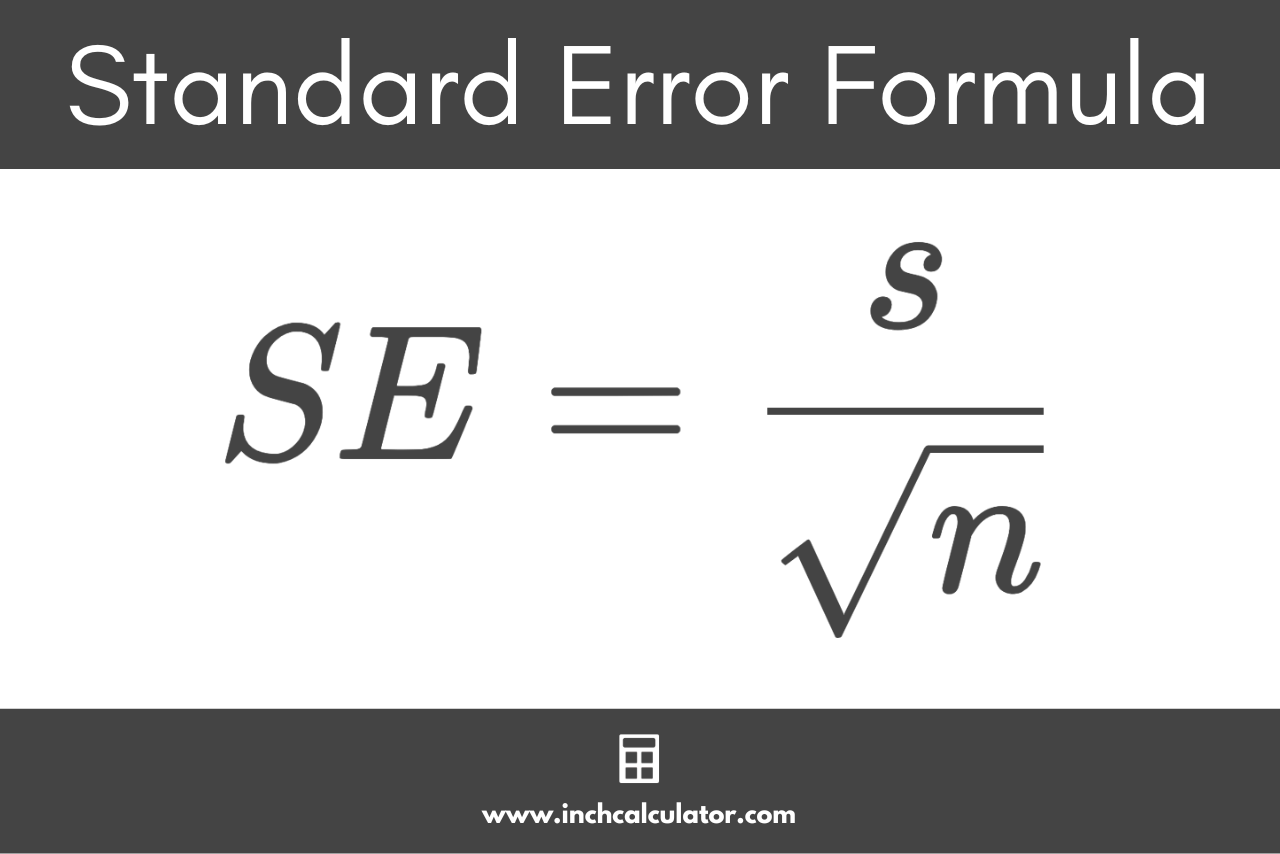
Standard Error Formula
The formula to calculate the standard error is:[3]
Where
SE = standard error
s = sample standard deviation
n = sample size
Thus, the standard error is equal to the standard deviation divided by the square root of the sample size.
Using the standard error formula, you can solve for SE in a few simple steps.
Step One: Calculate the Sample Size
The sample size is simply the count of the values. You can find it by counting the number of elements in the data set.
Step Two: Find the Standard Deviation
You can find the standard deviation for the sample using the following formula:
To solve for s, you’ll need to find the mean, sum of squares, and variance.
Step Three: Find the Standard Error
Then, using the standard deviation, you can find the standard error using the formula above.
For example, let’s find the standard error given a sample size of 20 and a standard deviation of 1.73
In this example, the standard error SE is equal to 0.387.
Similar Statistics Calculators
References
- Everitt, B. S., The Cambridge Dictionary of Statistics (3rd Edition), November 2006, 378. https://www.cambridge.org/9780511058042
- Tuovila, A., Standard Error of the Mean vs. Standard Deviation: What's the Difference?, Investopedia, https://www.investopedia.com/ask/answers/042415/what-difference-between-standard-error-means-and-standard-deviation.asp
- Altman, D., Standard deviations and standard errors, BMJ, Oct 15, 2005, 331(7521), 903. https://www.ncbi.nlm.nih.gov/pmc/articles/PMC1255808/