Confidence Interval Calculator
Enter the confidence level, sample size, sample mean, and standard deviation to find the confidence interval using the calculator below.
Results:
| Confidence Interval: | |
|---|---|
| Lower Bound: | |
| Upper Bound: | |
| Margin of Error: | |
| Standard Error: |
Steps to Solve:
Confidence Interval Formula
CI = x̄ ± z × σ / √n
Step One: Find the Z-Score
z-Score = ?
Step Two: Find the Standard Error
SE = σ / √n
Step Three: Find the Margin of Error
MOE = z × SE
Step Four: Find the Confidence Interval
CI = x̄ ± MOE
On this page:

Joe is the creator of Inch Calculator and has over 20 years of experience in engineering and construction. He holds several degrees and certifications.

Brian specializes in political science and statistics with several advanced degrees from Harvard.

Bailey is an experienced educator and specializes in K-12 math and science. She holds a Master's degree in professional education and holds several teaching certifications.
How to Find the Confidence Interval
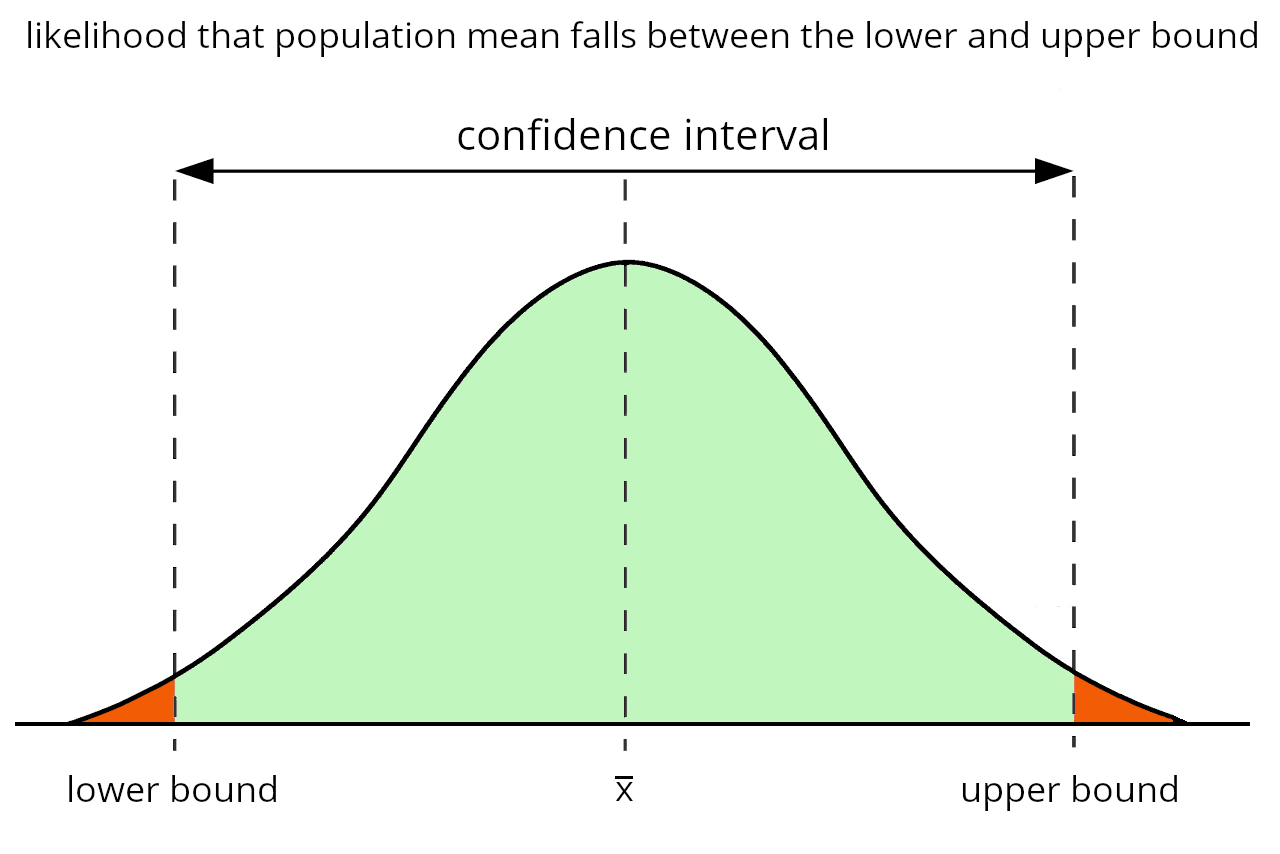
In statistics, a confidence interval is a range of values from a sample that are likely to contain an unknown population parameter value.
Because surveys are often done on a sample of a larger population, there will inevitably be some amount of error or difference between the sample and the full population. The amount of likely variability due to sampling can be estimated from the data and used to calculate quantities such as a margin of error and also confidence intervals.
The confidence interval is used to measure the uncertainty in a quantity calculated from a sample. It’s essentially the range of values that would likely occur if more samples were taken.
Importantly, the width of the confidence interval depends on how insistent you are that future samples should be inside the interval. If you are willing to tolerate a 50% chance that a future survey would turn up a substantially different answer, then your confidence interval can be smaller than if you insist that future samples would more rarely turn up different.
For instance, if you have a sample and know the mean of a variable in the sample, you can make an estimation with some level of certainty that the mean of the population will fall within a range. The confidence interval is that range.
Because nothing is ever certain, statisticians also use a confidence level, which is the probability that a variable in the full population falls within the confidence interval range.
So, if you’re using a 95% confidence level, then you might say that there is a 95% chance that the population mean will fall within a confidence interval range. The higher the confidence level, the wider the confidence interval will be, and vice versa.
The confidence interval is a range between a lower and upper bound. These bounds are equal to the sample mean minus the margin of error and the sample mean plus the margin of error, respectively.
You can use our margin of error calculator to find the margin of error for your sample.
A smaller confidence interval means that the range between the upper and lower bounds is narrower, and a larger confidence interval means that the range is wider. The narrower this range is, the more precise the estimate will be.
Confidence Interval Formula
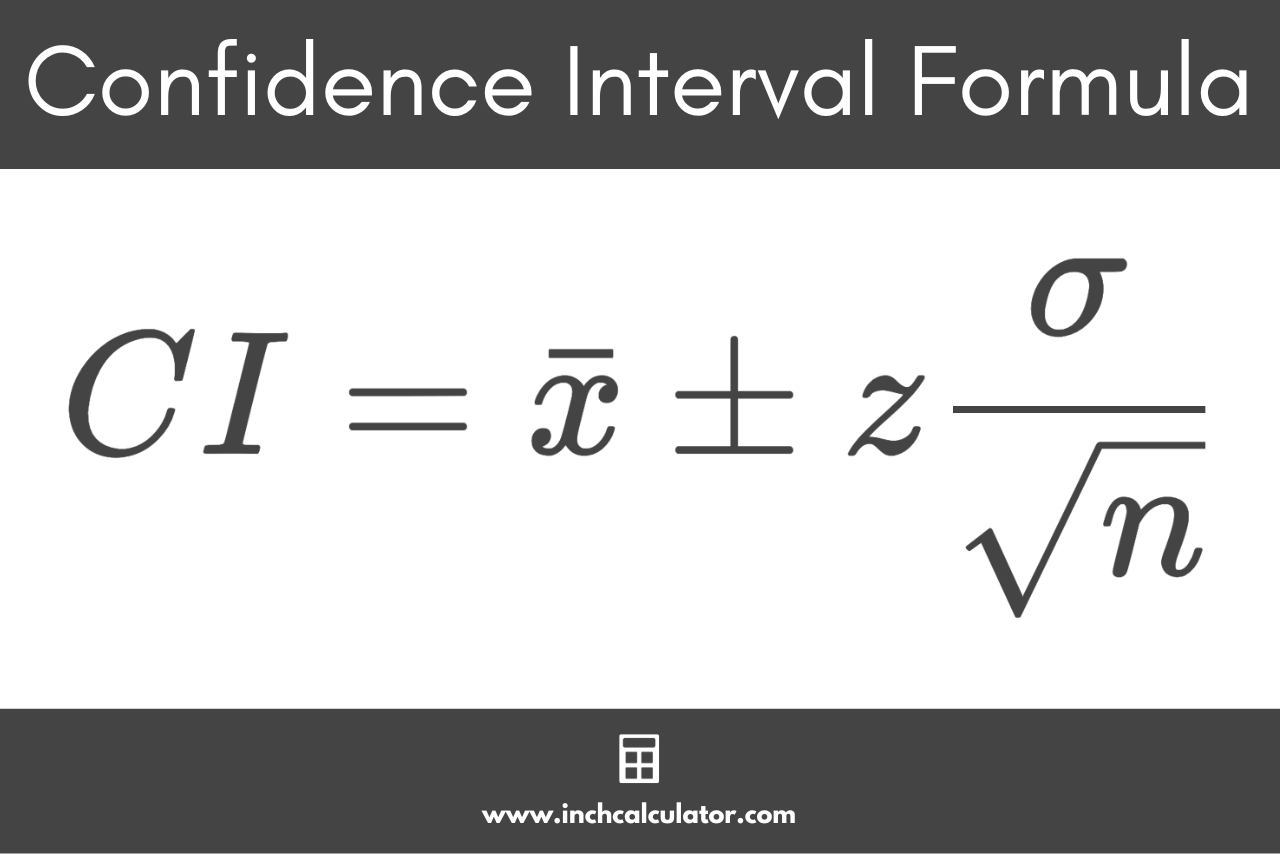
To find the confidence interval, you can use the following formula:
CI = x̄ ± z × σ / √n
Thus, the confidence interval is equal to the sample mean x̄ plus or minus the z-score for the confidence level z times the population standard deviation σ divided by the square root of the sample size n. Ideally, the standard deviation of the population would be used with this formula, but if you don’t know it, then the sample standard deviation can be used.
You can use this formula to calculate the confidence interval in four easy steps.
Step One: Find the Z-Score
You can find the critical value for your desired confidence level for a standard normal distribution (aka z-score) using the z-score table below. Learn more about z-values on our z-score calculator.
Step Two: Find the Standard Error
The standard error is equal to the population standard deviation divided by the square root of the sample size. That’s encapsulated in this portion of the formula above:
SE = σ / √n
Step Three: Find the Margin of Error
You can calculate the margin of error by multiplying the standard error by the z-score from the steps above.
MOE = z × SE
Step Four: Find the Confidence Interval
The final step to calculate the confidence interval is to add and subtract the margin of error from the sample mean to find the upper and lower bounds.
upper bound = x̄ + MOE
lower bound = x̄ – MOE
Thus, you could say that the confidence interval is equal to the sample mean plus or minus the margin of error.
CI = x̄ ± MOE
Let’s put these four steps together to find the confidence interval for a sample:
Example: Finding a 95% Confidence Interval
For example, let’s find the confidence interval for a sample with a mean of 14, a standard deviation of 2.5, and a size of 1500. Using a confidence level of 95%, we can use a z-score of 1.96 (see the table below).
Start by assigning values to the variables needed for the formula.
CI = 14 ± 1.96 × 2.5 / √1500
CI = 14 ± 1.96 × 2.5 / 38.73
CI = 14 ± 1.96 × 0.065
CI = 14 ± 0.1274
Thus, the confidence interval for this sample is equal to 14 plus or minus 0.1274.
You can find the lower and upper bounds to fully define the range for the confidence interval.
lower bound = 14 – 0.1274 = 13.8726
upper bound = 14 + 0.1274 = 14.1274
So, the confidence interval for this sample is between 13.8726 and 14.1274.
Z-Scores
The table below shows the z-values for various confidence levels.
| Confidence Level | Z-Score |
|---|---|
| 70% | 1.04 |
| 75% | 1.15 |
| 80% | 1.28 |
| 85% | 1.44 |
| 90% | 1.645 |
| 91% | 1.7 |
| 92% | 1.75 |
| 93% | 1.81 |
| 94% | 1.88 |
| 95% | 1.96 |
| 96% | 2.05 |
| 97% | 2.17 |
| 98% | 2.33 |
| 99% | 2.576 |
| 99.9% | 3.29 |
Frequently Asked Questions
When are confidence intervals used?
Confidence intervals are used in statistics and data analysis to estimate a range of values within which a population parameter (e.g., mean, proportion, variance) is likely to fall with a certain level of confidence.
Why are confidence intervals important?
Confidence intervals are important in statistics because they help us understand how sure we can be about our estimates. Here’s why they matter:
- Uncertainty: They show us a range of possible values for something we’re trying to figure out (like an average or a percentage). This range helps us see how uncertain our estimate might be.
- Better Choices: When we’re making decisions based on data, confidence intervals give us a better idea of what’s likely to be true and whether it is worth doing something different. For example, people do not like taking pharmaceuticals every day, and purchasing medicines is costly. We should only recommend that people put up with these costs and inconveniences if we are reasonably certain that doing so will make them healthier.
- Testing Ideas: Confidence intervals are useful in science to test if an idea we have (like a new medicine’s effectiveness) falls within a certain range. This makes it easier to decide if our idea is correct or not.
- Easy Communication: They help us explain our findings to others, like telling a friend, not just a single number, but also how sure we are about it.
- Comparing Things: Confidence intervals let us compare groups or things to see if they’re really different. For example, we can use them to decide if one group of people is taller than another.
- Dealing with Chance: Data can have some randomness due to chance. Confidence intervals consider this randomness, giving us a more accurate estimate and preventing hasty conclusions.
- Making Predictions: They are the building blocks for making educated guesses about things we don’t know much about based on what we’ve seen in our data. It’s like saying, “I think this is probably true, and here’s how sure I am.”
What is the purpose of the 95% confidence interval?
A 95% confidence interval gives you an educated guess for something, like an average or percentage, and a range of numbers that probably includes the real answer.
It’s like saying, “We’re pretty sure the answer is in this range, and we’re right about 95% of the time.” Put differently, we expect to be wrong about 1 out of every 20 times we do our analysis.
You can use different percentages if you want to be more or less sure about your guess. 95% prevails as a generally accepted standard of certainty appropriate in social and biomedical sciences, but in other subjects, such as experimental physics, the threshold for certainty might be much higher.
Some social scientists would consider 90% confidence intervals persuasive in some contexts, while others and in different contexts might want to see 99% confidence levels or higher.