Statistics Calculator
Find the descriptive summary statistics for a set of data by entering the numbers below. Keep reading to learn how to calculate each one.
Results:
| Min: | |
|---|---|
| Max: | |
| Count: | |
| Range: | |
| Sum: | |
| Mean: | |
| Median: | |
| Mode: | |
| Standard Deviation: | |
| Variance: | |
| Sum of Squares: | |
| Quartile Q1: | |
| Quartile Q2: | |
| Quartile Q3: | |
| Interquartile Range: | |
| Midrange: | |
| Mean Absolute Deviation: | |
| Coefficient of Variation: | |
| Relative Standard Deviation: |
| Min: | |
|---|---|
| Max: | |
| Count: | |
| Range: | |
| Sum: | |
| Mean: | |
| Median: | |
| Mode: | |
| Standard Deviation: | |
| Variance: | |
| Sum of Squares: | |
| Quartile Q1: | |
| Quartile Q2: | |
| Quartile Q3: | |
| Interquartile Range: | |
| Midrange: | |
| Mean Absolute Deviation: | |
| Coefficient of Variation: | |
| Relative Standard Deviation: | |
| Standard Error: |
On this page:
- Calculator
- How to Find the Minimum Value
- How to Find the Maximum Value
- How to Find the Count
- How to Find the Range
- How to Find the Sum
- How to Find the Mean
- How to Find the Median
- Formula for Datasets With Odd Numbers
- Formula for Datasets With Even Numbers
- How to Find the Mode
- How to Find the Standard Deviation
- How to Find the Variance
- How to Find the Sum of Squares
- How to Find the Quartiles
- How to Find the Interquartile Range
- How to Find the Midrange
- How to Find the Mean Absolute Deviation
- How to Find the Geometric Mean
- How to Find the Coefficient of Variation
- How to Find the Relative Standard Deviation
- How to Find the Standard Error

Joe is the creator of Inch Calculator and has over 20 years of experience in engineering and construction. He holds several degrees and certifications.

Brian specializes in political science and statistics with several advanced degrees from Harvard.
How to Find the Minimum Value
The minimum value is the smallest number in the set. To find the minimum value, start by ordering the numbers from smallest to largest, then simply find the smallest number.
How to Find the Maximum Value
The maximum value is the largest number in the set. Just like finding the minimum value, start by sorting the numbers from smallest to largest, then find the largest number.
How to Find the Count
The count is the size of the data set and is often denoted as n (or N). To find the count, simply count the number of elements in the set.
How to Find the Range
The range is the difference between the minimum value and the maximum value in the data.
Where:
max = highest number
min = lowest number
How to Find the Sum
The sum is the value of each number in the set added together. To find the sum, add up each number to find the total.
Where:
xi = each number in the set
n = number of items in the sample
You can also use a tool like our mean, median, mode calculator to find the sum automatically.
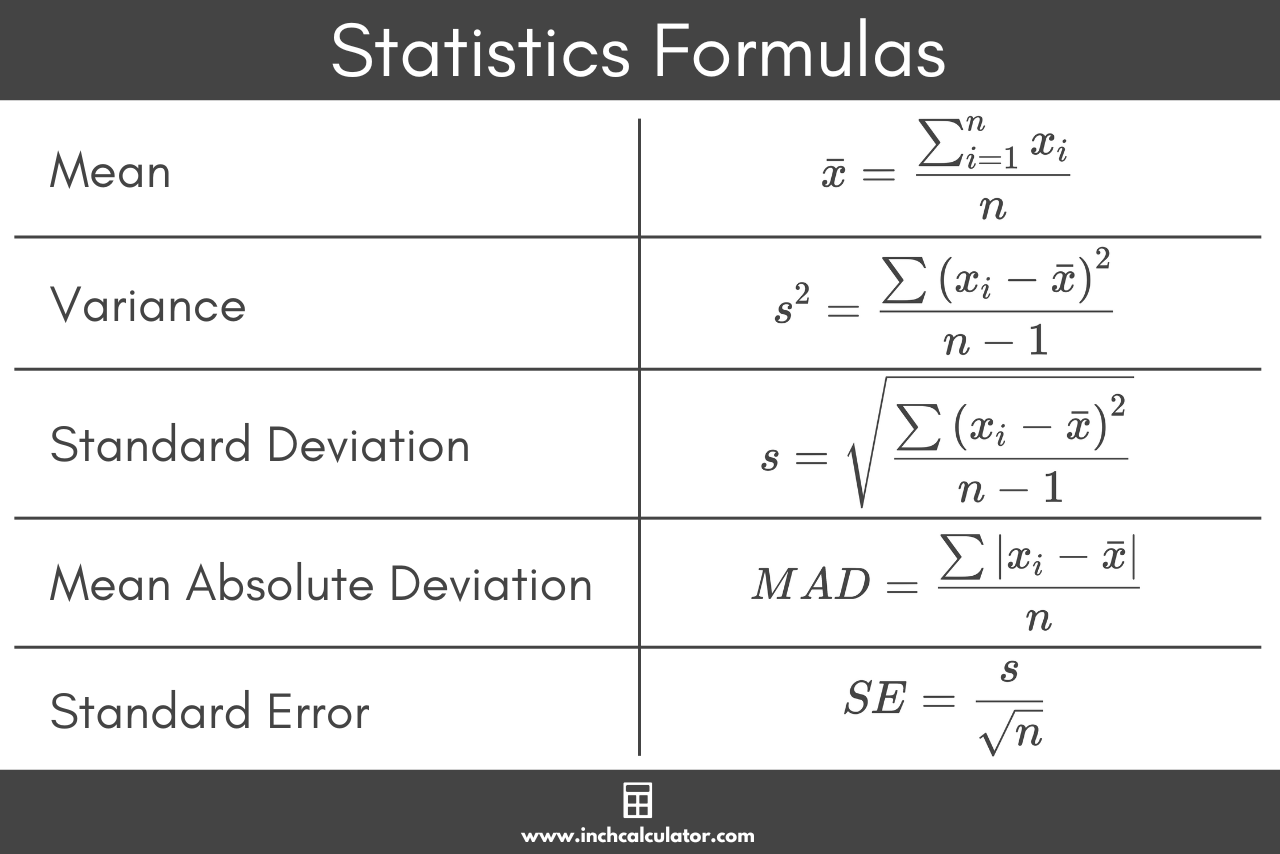
How to Find the Mean
The (arithmetic) mean is the average value of a set of numbers and is a measure of the central tendency of the data.
Where:
x̄ = mean
xi = each number in the set
n = number of items in the sample
How to Find the Median
The median is the middle value in the data set. The median is also a measure of the central tendency of the data. Often, the mean and the median will be the same, as for example in the normal distribution. If the distribution is skewed, however, the mean and median will frequently differ.
For example, mean household incomes are substantially higher than median household incomes, because the salaries of higher-income earners are more disparate than the salaries of lower-income earners.
To find the median, order the data from smallest to largest, then find the middle value in the set. If the number of values in the set is even, then the median is equal to the mean of the middle two values.
Formula for Datasets With Odd Numbers
The median is equal to the (n + 1)/2th term in the dataset, which is equal to the number at the index of the count of the data n plus 1, divided by 2.
Formula for Datasets With Even Numbers
Where:
n = number of items in the set
The median is equal to the n/2th term plus the (n/2) + 1th term, divided by 2.
How to Find the Mode
The mode is the value that occurs most often in the data set. It’s possible for a data set to have multiple modes, if multiple values repeat the same number of times.
If every value in a dataset is unique, then every value is a mode. Informally, some analysts may, in this context, say that the data has no mode, although this is imprecise.
To find the mode, document the frequency that each value occurs in the data. The mode will be the number with the greatest frequency of occurrence.
Where:
L = lower limit of the modal class
fm = frequency of the modal class
f1 = frequency of the class preceding the modal class
f2 = frequency of the class succeeding the modal class
h = size of the class interval
How to Find the Standard Deviation
The standard deviation is a measure of the dispersion or variance between numbers in a data set.
Where:
x̄ = sample mean
xi = each number in the set
n = number of items in the sample
How to Find the Variance
The variance is the measure of the variability from the mean in a data set. The variance is equal to the standard deviation squared.
Where:
x̄ = sample mean
xi = each number in the set
n = number of items in the sample
How to Find the Sum of Squares
The sum of squares is a measure of the deviation from the mean for numbers in a data set. It’s often used to calculate variance and standard deviation.
Where:
x̄ = sample mean
xi = each number in the set
How to Find the Quartiles
Quartiles mark the boundaries or divisions of a data set into four equally sized groups.
The first quartile is the median of the lower half of the data, while the third quartile is the median of the upper half.
- Q1 – first quartile – 25th percentile of the data
- Q2 – second quartile – 50th percentile of the data
- Q3 – third quartile – 75th percentile of the data
How to Find the Interquartile Range
The interquartile range is the difference between the first and third quartiles. It is a measure of variability, spread, and dispersion, however it is less sensitive to outliers than other measures that might be chosen.
Where:
Q1 = first quartile
Q3 = third quartile
How to Find the Midrange
The midrange is the arithmetic mean of the smallest and largest numbers in a data set.
Where:
min = lowest number
max = highest number
How to Find the Mean Absolute Deviation
The mean absolute deviation is the average absolute difference between each value in the set and the mean.
Where:
x̄ = sample mean
xi = each number in the set
n = number of items in the sample
How to Find the Geometric Mean
The geometric mean is the average of a data set that is found using the nth root of the product of each number in the set, where n is the size of the set.
Alternatively, you might regard it as an arithmetic average “on the log scale”, as it is the exponentiated arithmetic average of the logarithms of each number in the set.
Where:
xi = each number in the set
n = number of items in the sample
How to Find the Coefficient of Variation
The coefficient of variation is a measure of relative variability or dispersion of data around the mean in a sample or population. It is formally defined as the ratio of the standard deviation to the mean. In a sample, it may be calculated as follows:
Where:
s = standard deviation
x̄ = sample mean
How to Find the Relative Standard Deviation
The relative standard deviation is a measure of how closely the data is clustered around the mean in a sample or population. It is closely related to the coefficient of variation, although the former can be positive or negative while the latter can only be positive.
Where:
σ = standard deviation
μ = population mean
How to Find the Standard Error
The standard error is the standard deviation of a sample mean from the actual population mean.
Where:
s = standard deviation
n = number of items in the sample