Quartile Calculator – IQR Calculator
Find the first, second, and third quartiles and the interquartile range of a data set by entering the numbers in the calculator below.
Results:
| First Quartile (Q1): | |
|---|---|
| Second Quartile (Q2): | |
| Third Quartile (Q3): | |
| Interquartile Range (IQR): | |
| Min: | |
| Max: | |
| Range: |
On this page:

Joe is the creator of Inch Calculator and has over 20 years of experience in engineering and construction. He holds several degrees and certifications.

Brian specializes in political science and statistics with several advanced degrees from Harvard.
How to Find Quartiles
In statistics, quartiles mark the boundaries or divisions of a data set into four equally sized groups. Quartiles are one of the most commonly used kinds of quantiles, which is the more generic term for numbers that partition a set of data into equally sized segments.
Other commonly used quantiles are quintiles (dividing the data into 5 parts), deciles (dividing the data into 10 parts), or percentile (dividing the data into 100 parts).
Typically, analysis of quartiles is done to get a sense of how values differs across a range of the data. In this sense, thinking about differences between quartiles is similar to think about differences between the mean and the first or second standard deviation.
Particularly if the data is skewed in some way, so does not seem to come from a bell curve, it may make more sense to use quartiles or some other kind of quantile for analysis.
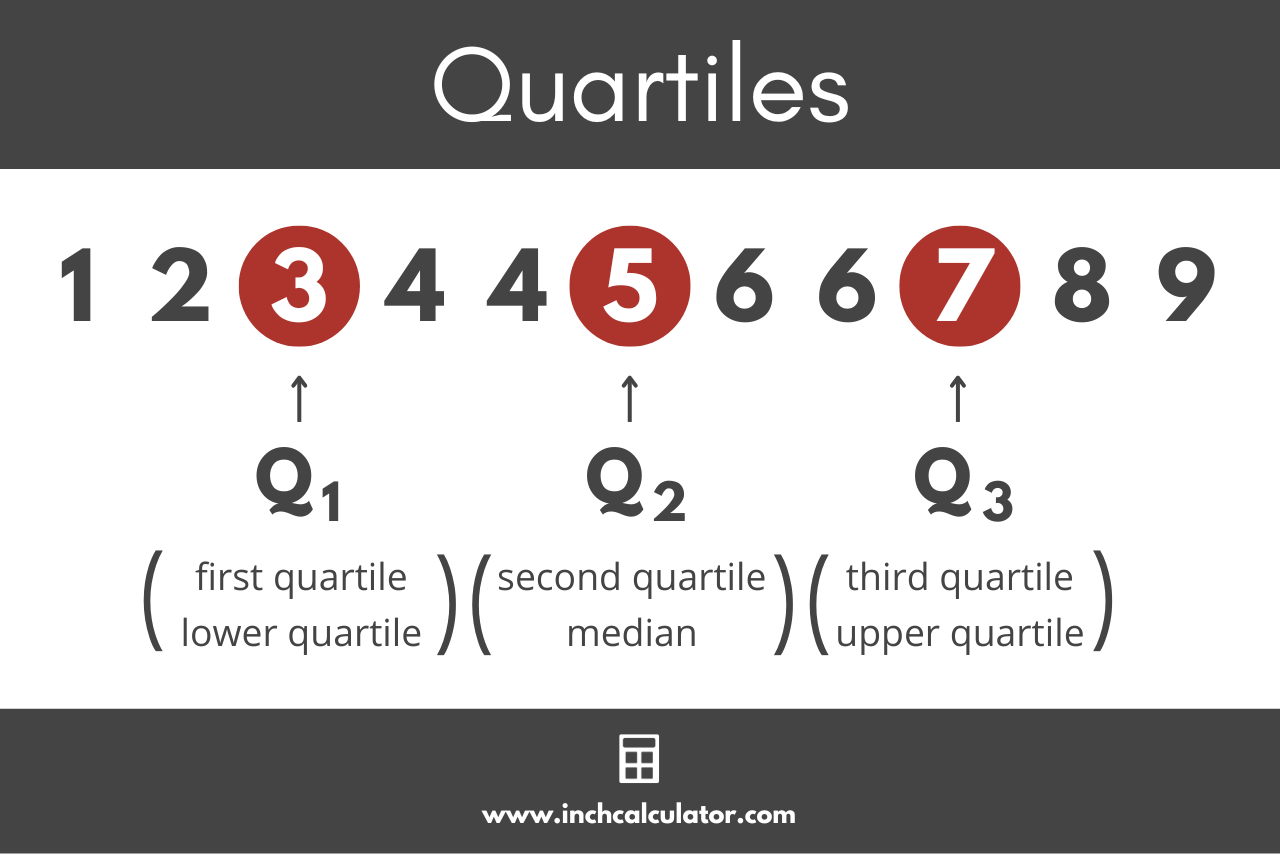
Given a set of ordered data, when it is split up into four equal groups, the quartiles are the three values that separate each of the groups.
The first quartile is also called the “lower” or “bottom” quartile and is denoted Q1. It represents the 25th percentile, so 25% of the data will be below the first quartile, and 75% will be above it.
The second quartile is also the median of the data, and it’s denoted Q2. The median is a quartile marking the division that separates the upper and lower halves of the data. It represents the 50th percentile, so 50% of the data will be below this quartile.
The third quartile is also called the “upper” or “top” quartile and is denoted Q3. It represents the 75th percentile, so 75% of the data will be below it, and 25% will be above it.
- Q1 – first quartile – 25th percentile of the data
- Q2 – second quartile – 50th percentile of the data
- Q3 – third quartile – 75th percentile of the data
As a technical matter, quartiles refer to the cut points that separate the data in the fashion described above. Somewhat more loosely, and commonly, statisticians and social scientists will use the term quartile (or “percentile” or “decile”) to refer to the segment of the data that the quantile implies, rather than the cutpoint in the data itself.
For example, the bottom quartile might refer to the lowest-scoring 25% of test-takers (a segment of a class), rather than a particular score on the test (i.e. 77%). The same is true of other quantiles: the top decile of income earners is usually meant to refer to the set of individuals making more than 90% of others, rather than the particular six-figure salary that it takes to get there.
You can find the quartiles by following a few simple steps.
Step One: Sort the Data
When calculating quartiles, it is essential that you’re working with ordered data, so the first step is to sort the data set from smallest to largest. You can use our least to greatest calculator to speed this step up.
Step Two: Find the Median
The second step to finding the quartiles is to find the median. As we noted above, the median is also the second quartile.
The median is the number that is exactly in the middle of the data set. If the data contains an even amount of numbers, then the median is actually the mean of the middle two numbers.
Step Three: Split the Data into Halves
Next, split the data set into two halves, separated by the median. The numbers below the median will be the first half, and the numbers above the median will be the second.
Step Four: Find the Quartiles
Now it’s time to find the quartiles.
The first quartile is the median value of the first half of the data. You can find it just like finding the median.
The third quartile is the median value of the second half of the data.
For example, let’s find the quartiles of the data [4,8,5,5,7,3,9]
Let’s start by sorting the numbers from smallest to largest. The sorted data should look like this:
[3,4,5,5,7,8,9]
Then, let’s find the median. Recall that the median is the number exactly in the middle.
[3,4,5,5,7,8,9]
Next, split the data into two halves on either side of the median. The two halves should look like this:
[3,4,5] & [7,8,9]
And finally, let’s find the quartiles. Recall that the quartiles are the numbers in the middle of each of the halves of the data.
[3,4,5] & [7,8,9]
So, the quartiles in this data set are:
Q1 = 4
Q2 = 5
Q3 = 8
How to Find the Interquartile Range
The interquartile range, or IQR, is the difference between the first and third quartiles. The interquartile range and quartiles are often used to find outliers in the data.
Like the standard deviation, the interquartile range is a measure of dispersion, and it may be preferred in cases where the data is not thought to come from a normal distribution for some reason.
For example, if there is not a lot of data, or the data is not continuous, or if the tail ends of the distribution are quite different than the bulk of the distribution, then these are all cases where someone might prefer to focus on the interquartile range than the standard deviation.
Finding the interquartile range is very similar to finding the range of the data. The only difference is that the first and third quartiles are used rather than the min and max values.

To find the interquartile range, use the formula:
IQR = Q3 – Q1
Where:
IQR = interquartile range
Q1 = first quartile
Q3 = third quartile
Thus, the interquartile range IQR is equal to the third quartile Q3 minus the first quartile Q1.