Outlier Calculator
Find the outliers in a data set by entering the numbers in the calculator below.
Results: Outliers
| First Quartile: | |
|---|---|
| Third Quartile: | |
| Interquartile Range: | |
| Lower Fence: | |
| Upper Fence: |
Steps to Solve:
Step One: Find the Quartiles
The first step is to find the quartiles for the data set.
For this data set, the quartiles are:
Q1 = ?
Q3 = ?
Step Two: Find the Interquartile Range
The interquartile range is the difference between the first and third quartiles.
IQR = Q3 - Q1
Step Three: Find the Fences
The next step is to set up a fence beyond the first and third quartiles using the interquartile range.
Lower Fence = Q1 - (1.5 × IQR)
Upper Fence = Q3 + (1.5 × IQR)
Step Four: Find the Outliers
Any numbers in the data that are above or below the fences are outliers.
On this page:

Joe is the creator of Inch Calculator and has over 20 years of experience in engineering and construction. He holds several degrees and certifications.

Pateakia has worked in education for 15 years and has three degrees, including a PhD, Master's degree, and Bachelor's degree. She specializes in mathematics.
How to Find Outliers
In statistics, outliers are observations that lie an abnormal distance from other values in a set of data. These data points are considered unusual and are often problematic in statistical analyses because they tend to distort the results.
There are a few methods that you can use to find outliers in the data.
Method One: Visually Identify Outliers
The first method is to visually identify outliers. Looking at the scatter plot graph below, the red outliers are easily identified.
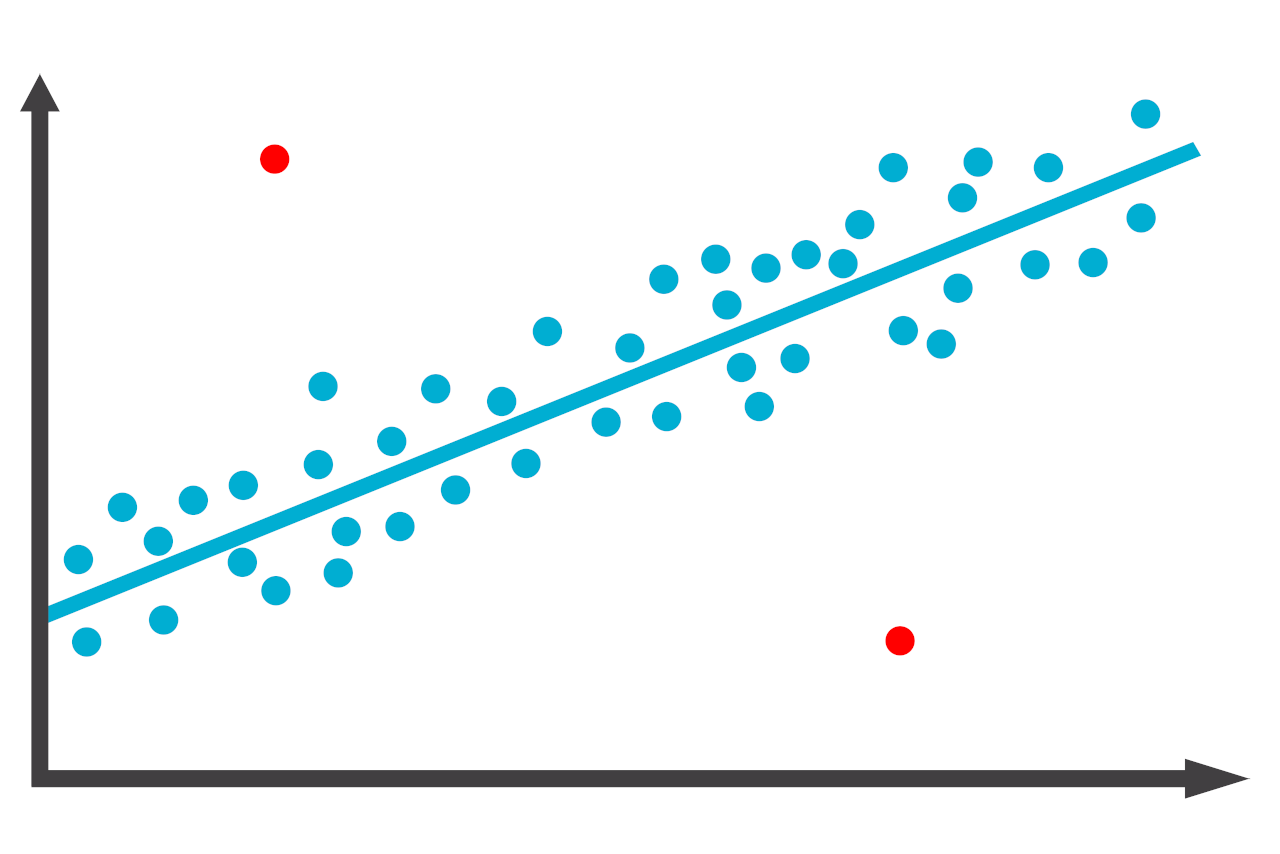
Looking at the graph, two values look unusual compared to the other data. Notice how the blue dots follow the line closely, and the red dots do not. They are considered the outliers.
Method Two: Using the IQR Method
The second method to find outliers in the data is to use the interquartile range method. To use this method, find the quartiles and interquartile range for the data.
Split the data in half, then the first quartile is the median for the half.
The first quartile (lower quartile) is the median value of the first half of the data.
The third quartile (upper quartile) is the median value of the second half of the data.
The interquartile range (IQR) is the difference between the first and third quartiles. You can find the interquartile range using the formula:
Using the quartiles and interquartile range, set fences beyond the quartiles. Any values in the data that are smaller than the lower fence or larger than the upper fence are outliers.
You can find the fences using the following formula:[1]
Method Three: Using Z-Scores
The third method to find outliers in the data is to use z-scores. To use this method, calculate z-scores for each observation.
The further the value’s z-score is from zero, the more unusual the value is. Another way to state that is the more standard deviations away from the mean the value is, the more unusual.
Values with a z-score above 3.0 or below -3.0 are considered outliers using this method.[2]
This is similar to the Grubbs’ Test below.
Method Four: Using Grubbs’ Test
Given a normally distributed data set with a minimum of seven values, the Grubbs’ Test can also be used to identify outliers. To use Grubb’s Test, you need to find the G test statistic, find the critical value for it, compare the test statistic to the critical value, and then reject the value as an outlier if the test statistic is greater than the critical value for G.
To find the Grubbs’ test statistic, which is the largest deviation from the sample mean, use the following formulas:[3]
Left-Tailed Test
Right-Tailed Test
Where:
x̄ = sample mean
xmin = minimum value in the sample
s = sample standard deviation
Critical Value
Now, find the critical value to compare to. When the test statistic is greater than the critical value, the value can be rejected as an outlier.
Where:
n = sample size
t = tn-2,p
p = 1 – α/(2n)
Grubbs’ Test is also known as the extreme studentized deviate test, or ESD test.
Similar Statistics Calculators
References
- PennState Eberly College of Science, Elementary Statistics - 3.2 - Identifying Outliers: IQR Method, https://online.stat.psu.edu/stat200/lesson/3/3.2
- Mahmood, M. S., Outlier Detection (Part 1), Towards Data Science, https://towardsdatascience.com/outlier-detection-part1-821d714524c
- National Institute of Standards and Technology, Engineering Statistics Handbook - 1.3.5.17.1. Grubbs' Test for Outliers, https://www.itl.nist.gov/div898/handbook/eda/section3/eda35h1.htm