Z-Score Calculator
Enter the raw score, population mean, and standard deviation to find the z-score using the calculator below.
Results: Z-Score
Steps to Solve:
Use the Z-Score Formula
Substitute Values and Solve to Find the Z-Score
On this page:

Joe is the creator of Inch Calculator and has over 20 years of experience in engineering and construction. He holds several degrees and certifications.

Brian specializes in political science and statistics with several advanced degrees from Harvard.
How to Find the Z-Score
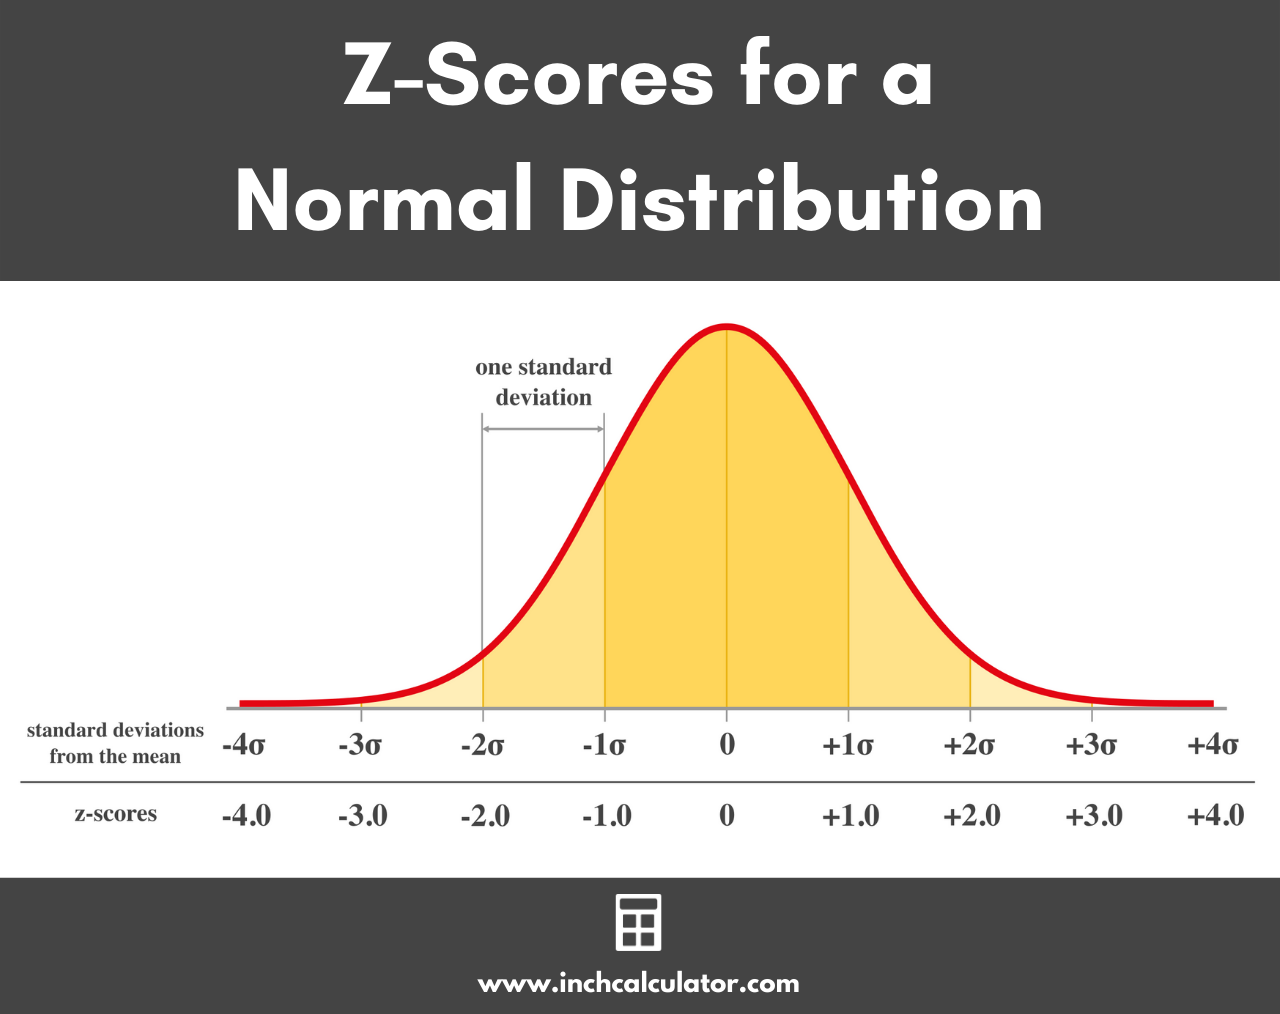
In statistics, the z-score, also called the standard score, is the number of standard deviations that a value is from the mean value. Each data point (aka raw score) that comes from a normal distribution has a z-score, which is the number of standard deviations away from the mean of the population.
Z-scores are useful summary statistics because they allow you to calculate the probability of a statistic, assuming data arises from a standard normal distribution. This probability is also commonly known as the p-value. You can also use it to calculate the margin of error in survey data, for example.
Of course, the easiest way to find the z-score is to use the calculator above, but you can also find it using a formula.
Z-Score Formula
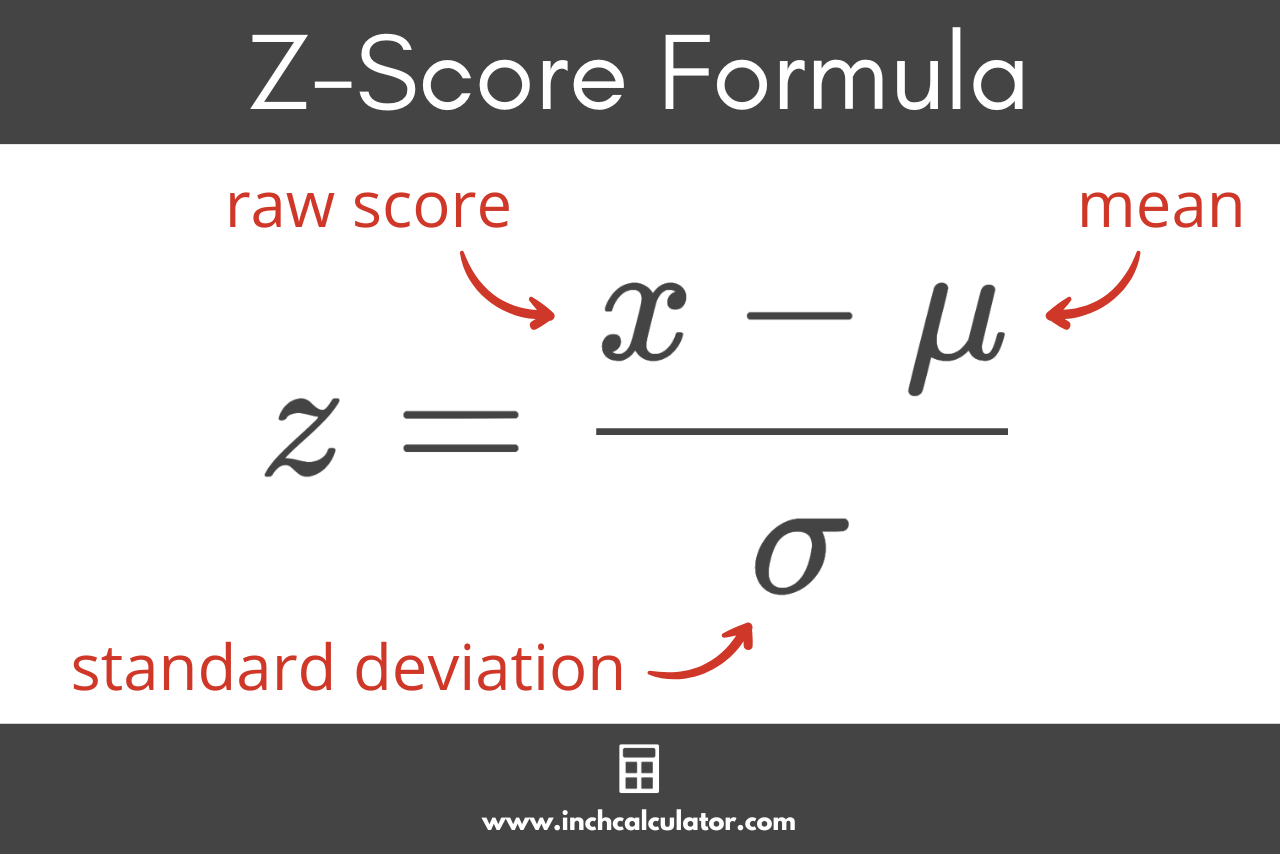
You can find the standard score for any value in a normal distribution using the z-score formula if you know the mean and standard deviation.
Thus, the z-score z for a data point x is equal to x minus the population mean μ, divided by the standard deviation σ.
If x comes from a normal distribution that is different than the standard normal distribution, then subtracting by μ demeans the data so that x – μ will now come from a normal distribution with zero mean. Dividing by σ rescales the data so that x – μ/σ will have a variance equal to 1. A normal distribution with mean zero and variance equal to 1 is a standard normal distribution.
Steps to Find the Z-Score
You can find the z-score for a value in a few simple steps.
Step One: Find the Mean
The first step to finding the z-score is to find the mean for the population. You can use a mean calculator or use the mean formula. Alternatively, the mean may be given to you as an assumption.
The population mean μ is equal to the sum of all of the values in the population xi, divided by the count of values in the population N.
Step Two: Find the Standard Deviation
The second step is to find the standard deviation for the data set. You can use a standard deviation calculator or the standard deviation formula.
The standard deviation σ is equal to the square root of the sum of squares divided by the population size N, where the sum of squares is equal to the sum of each value minus the population mean squared.
Step Three: Find the Z-Score
The final step to finding the z-score is to use the formula above and substitute the values for the mean and standard deviation.
For example, let’s say Jane was taking a statistics course, and she received a score of 93 on her final exam. The average score in the class was 89 and had a standard deviation of 3. Let’s calculate the z-score for Jane’s score.
Thus, the z-score for Jane’s exam score is equal to 1.33.
How to Find the Z-Score for Sample Means
It’s also possible to calculate the z-score for a random sample of raw scores. The resulting score will be the distance in standard errors between the sample mean and population mean.
Z-Score of a Sample Formula
The z-score for the sample is equal to the sample mean x̄ minus the population mean μ, divided by the standard error of the mean, which is equal to the population standard deviation σ divided by the square root of the number of observations n in the sample.
This is very similar to the one-sample t-test formula. The difference is that the denominator here depends on the population standard deviation, which is treated as a given, while the one-sample t-test uses a sample standard deviation, which is estimated from the data.
How to Interpret a Z-Score
As noted above, the z-score is equal to the distance of a value from the mean in standard deviations, but what does that actually tell us? There are a few things we can take away from the z-score after we calculate it.
First, a positive z-value means that the raw score is greater than the mean, while a negative z-value means that the raw score falls below the mean. A z value of 0 means that the raw score is equal to the mean.
The more different the z-score is from 0, the more unusual a particular data point is and unlikely to have occurred. Indeed, using the normal cumulative distribution function or a z-table (see below), one can quantify just how unlikely it is to see such a data point given the implicit (often good) assumption that the data is normal. Z-scores can also be used in outlier detection.
A z of greater than 3 or less than -3 has a roughly 3 in 1000 chance of appearing if the data is normal. A data point with such a score might be an outlier.
What is a Z Table?
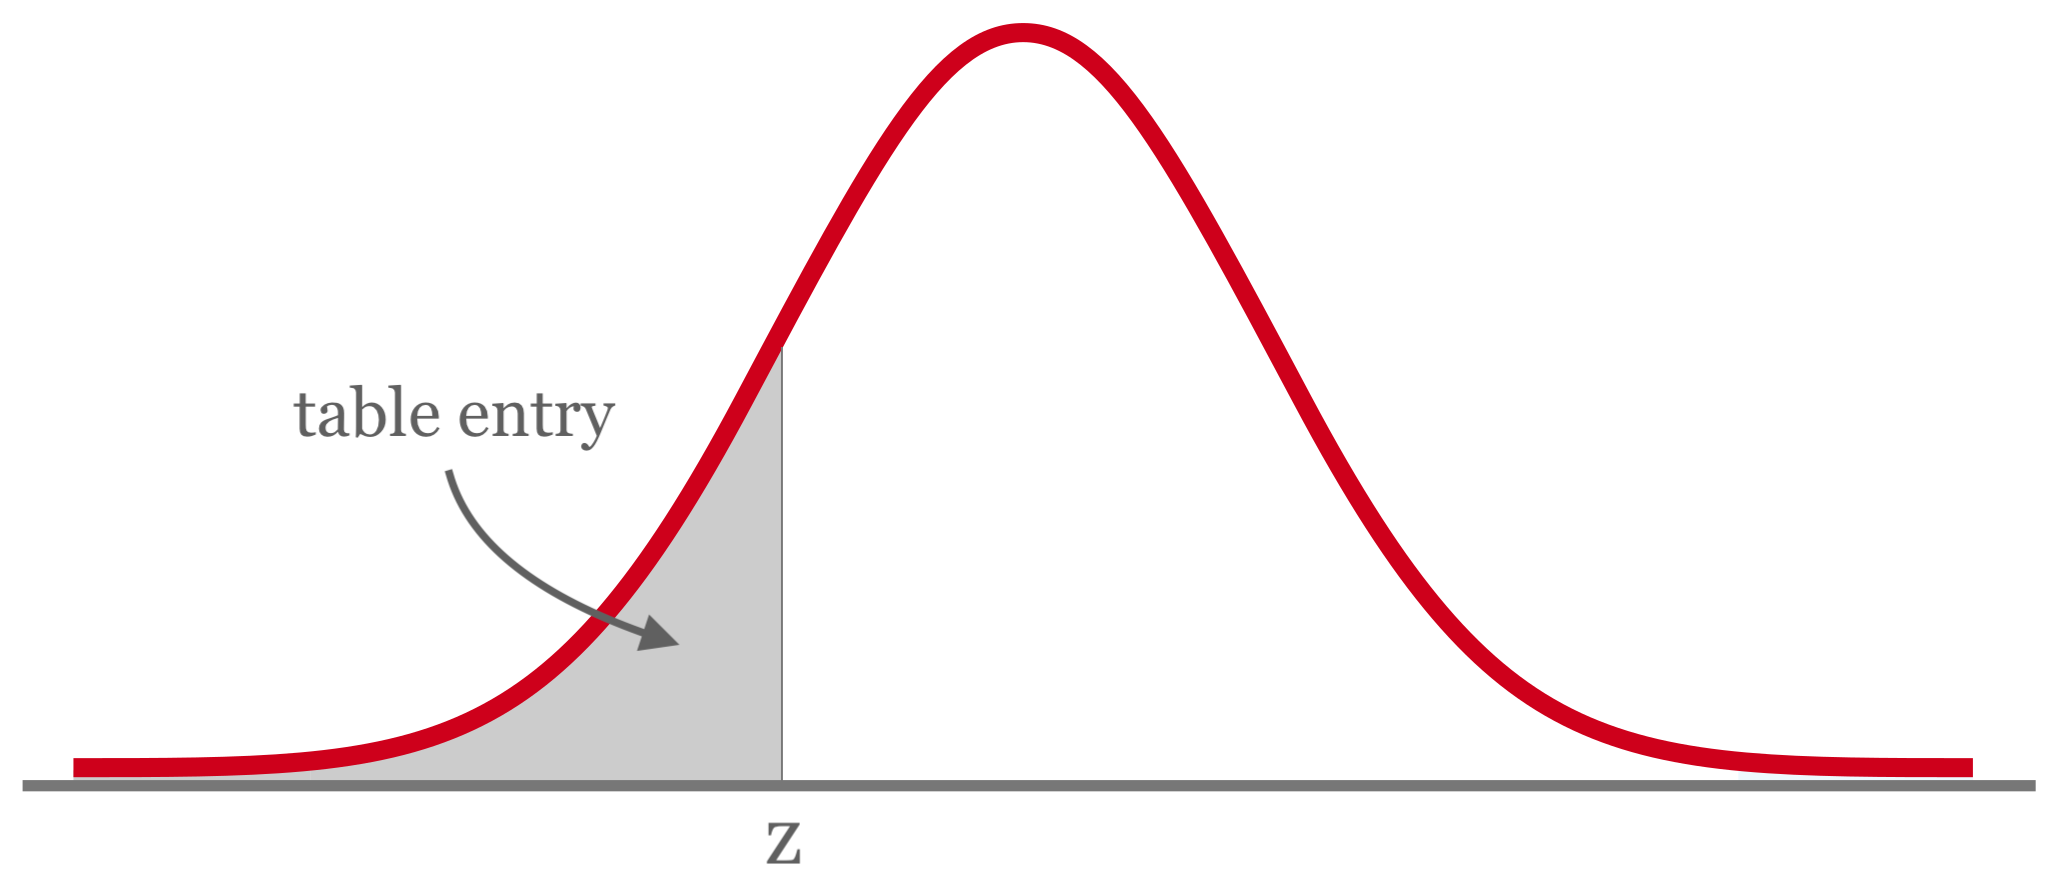
You might have also heard of a z table. A z table is a table that allows you to find the probability of a value being to the left of a z-score in a normal distribution. Prior to the widespread availability of calculators able to calculate normal CDFs, these tables were commonly used by data analysts, and z tables are still often presented in courses to give students a better understanding of what the normal CDF function is doing.
Each entry in the z table represents the area under the normal distribution bell curve to the left of z. Typically, you would take the z-score (say 1.33) and read down the left column to find a row that is close to the z-score you want to look up (i.e. 1.3).
Then, you would proceed across the columns to get even closer (i.e. stopping at 1.33 and 1.34). The entries would allow you to know the probability of the z-score in question (i.e. between 0.092 and 0.090). More detailed and granular tables are available for those who need greater accuracy. These are the left-tailed p values for the z-score.
A z table is also sometimes called a standard normal table.
Frequently Asked Questions
What is the difference between a z-score and a p-value?
A z-score is a statistic, meaning that it presents a summary of some data. A p-value is the probability of observing a particular statistic under some prior assumptions about the data.
The reason they are confused is that there is a one-to-one relationship between z-scores and p-values, so if you know the probability of an observation under some data, you can calculate its z-score, and if you know the z-score, you can calculate its p-value.
Does it always make sense to calculate a z-score?
Z-scores are best used if the data seems to follow a normal probability distribution. If the data is highly skewed or constrained in some ways (for example, no negative values), then you might need to transform the data in some way to get the normality assumption to make sense or alternatively try another approach, for example, focused on quantiles.
Is a z-value the same as a t-value?
While both z-scores and t-scores are a measure of the standard deviations away from the mean of the population for a data point, a z-score should only be used when the data is normally distributed and the sample size has at least 30 observations. For smaller samples that are normally distributed with less than 30 observations, the t-test should be used.
A z-test can be used when the standard deviation of the sample is known, but a t-test makes the assumption that the standard deviation is not known.