Margin of Error Calculator
Enter the confidence level, sample size, sample proportion, and population size to find the margin of error using the calculator below.
Results: Margin of Error
Steps to Solve:
Margin of Error Formula
Step One: Find the Z-Score
z-score = ?
Step Two: Find the Margin of Error
MOE = ?
On this page:

Joe is the creator of Inch Calculator and has over 20 years of experience in engineering and construction. He holds several degrees and certifications.

Brian specializes in political science and statistics with several advanced degrees from Harvard.
How to Find the Margin of Error
In statistics, the margin of error is the amount of error in random sampling surveys. Because surveys are performed on a sample of a larger population, there will inevitably be some amount of error.
A lower margin of error produces higher confidence levels in a survey sample. Thus, the margin of error is a good indicator of the confidence you can have in the sample or survey results.
The margin of error is expressed as a percentage indicating the degree that the sample results differ from the total population, for instance, when calculating a confidence interval.
Margin of Error Formula
The margin of error is equal to the z-score for the confidence level times the standard error. You can find the margin of error using the following formula:
Where:
z = critical value for the confidence level (z-score)
σ = standard deviation
n = sample size
Thus, for a normal distribution of data, the margin of error is equal to the z-score z times the population standard deviation σ divided by the square root of the sample size n. You can find the z-score for your desired confidence level in the table below.
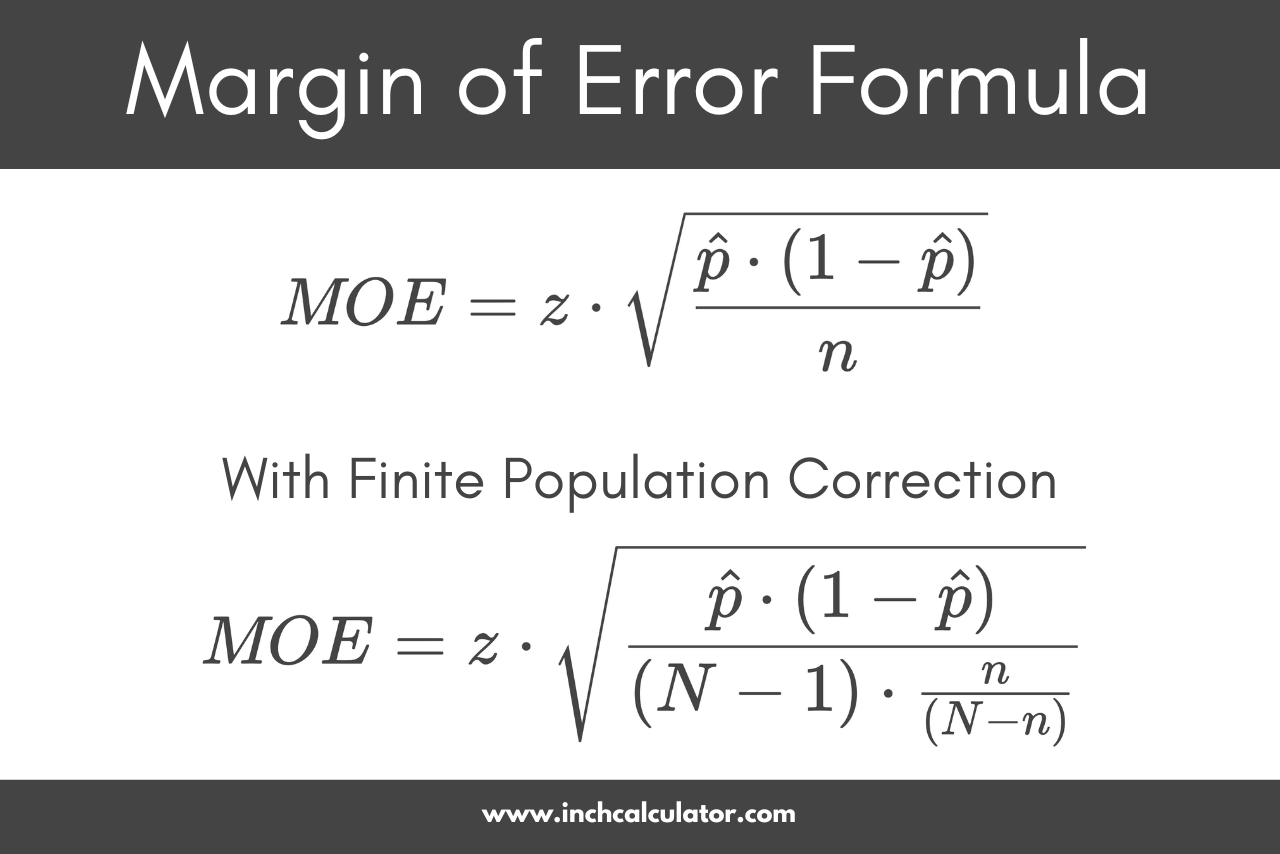
Margin of Error Formula for a Sample
While you can calculate the standard deviation using a calculator, you can also use the sample proportion to calculate it. The sample proportion is denoted p̂ and represents the percentage of the sample that has the characteristic you’re interested in.
The standard deviation σ can be expressed with the formula, where p̂ is the sample proportion:
By substituting this formula for the standard deviation into the formula above, you can calculate the margin of error using this formula:
Where:
z = critical value for the confidence level (z-score)
p̂ = sample proportion
n = sample size
Thus, the margin of error is equal to the z-score z times the standard error, which is the square root of the sample proportion p̂ times 1 minus the sample proportion p̂, divided by the sample size n.
Margin of Error Formula with Finite Population Correction
The above formulas are valid assuming an infinitely large population, but populations are typically finite. If the sampled population is small relative to the overall population, it is fine to analyze the data as if it were practically infinite because the difference in formulas is negligible.
But if the population sampled is a substantial fraction of the overall population, say 5% or more, then the modeling assumptions about the population could matter.
To calculate the margin of error with finite population correction, you can use the following formula:
Where:
z = critical value for the confidence level (z-score)
p̂ = sample proportion
n = sample size
N = population size
The margin of error with finite population correction is equal to the z-score z times the square root of the sample proportion p̂ times 1 minus the sample proportion p̂, divided by the population size N minus 1, times the sample size n divided by the population size N minus the sample size n.
For example, let’s find the margin of error for a survey asking people what their favorite color is. The survey sampled 250 people (out of a much larger population), and 40% of respondents answered that their favorite color was red. We want a 95% confidence level in the margin of error.
Start by assigning values to the variables needed for the formula.
z = 1.96 (95% confidence = 1.96 [table])
p̂ = 0.4 40% ÷ 100 = 0.4
n = 250 sample size
Next, substitute the variables in the formula and solve.
Then, multiply the margin of error by 100 to convert it to a percentage.
Thus, the margin of error is equal to ±6.073%. Or rather, we are 95% confident that 40% of the total population, plus or minus 6.073%, has the favorite color of blue.
Z-Scores
The table below shows the z-scores for various confidence levels.
| Confidence Level | Z-Score |
|---|---|
| 70% | 1.04 |
| 75% | 1.15 |
| 80% | 1.28 |
| 85% | 1.44 |
| 90% | 1.645 |
| 91% | 1.7 |
| 92% | 1.75 |
| 93% | 1.81 |
| 94% | 1.88 |
| 95% | 1.96 |
| 96% | 2.05 |
| 97% | 2.17 |
| 98% | 2.33 |
| 99% | 2.576 |
| 99.9% | 3.29 |