Median Calculator
Calculate the median of a number set using the calculator below.
Results:
| Median: |
|---|
Sorted Data:
On this page:

Joe is the creator of Inch Calculator and has over 20 years of experience in engineering and construction. He holds several degrees and certifications.


How to Find the Median
The median is the middle value of a dataset and is a way to express the midpoint of a set of numbers. The median is a measure of the central tendency of numeric data.
The median is one way to express the center of a set of numbers. Half of the numbers will be higher than the median and half will be lower.
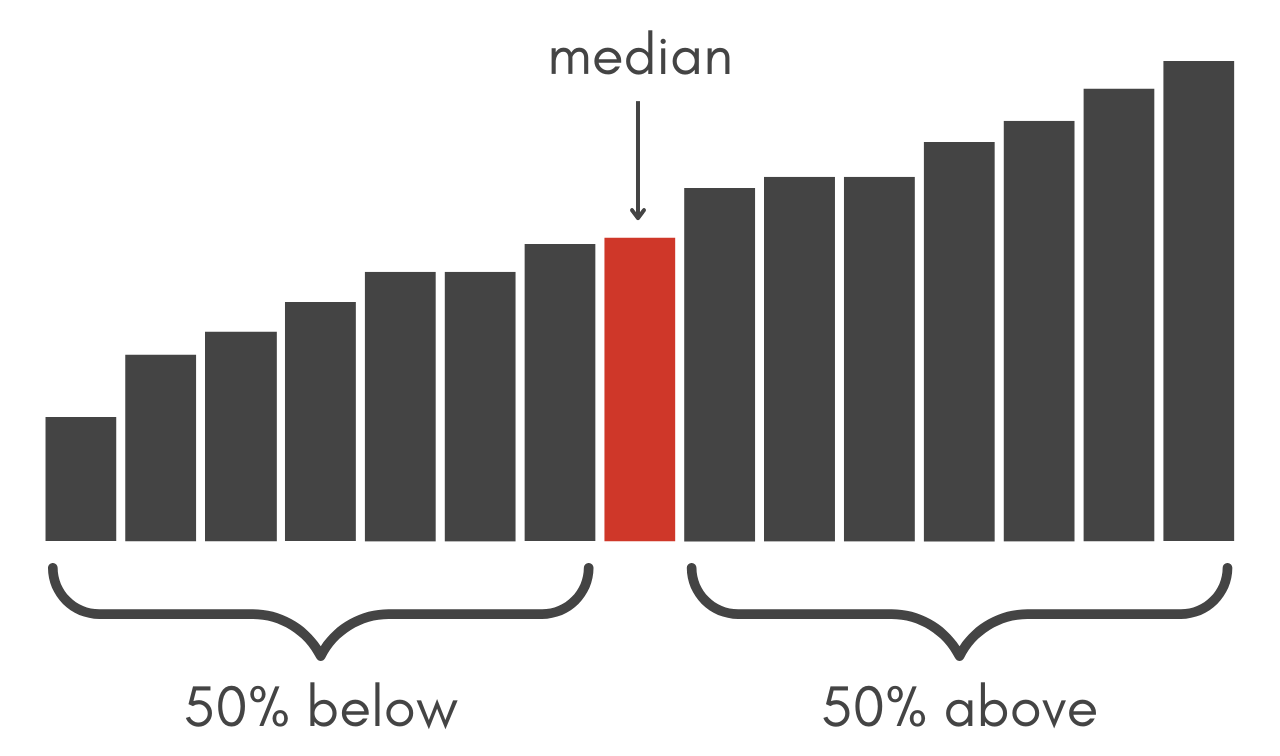
Before you can find the median of a data set, the data needs to be sorted in ascending order. Sort the numbers from lowest to highest, then count the numbers in the set.
Median Formula
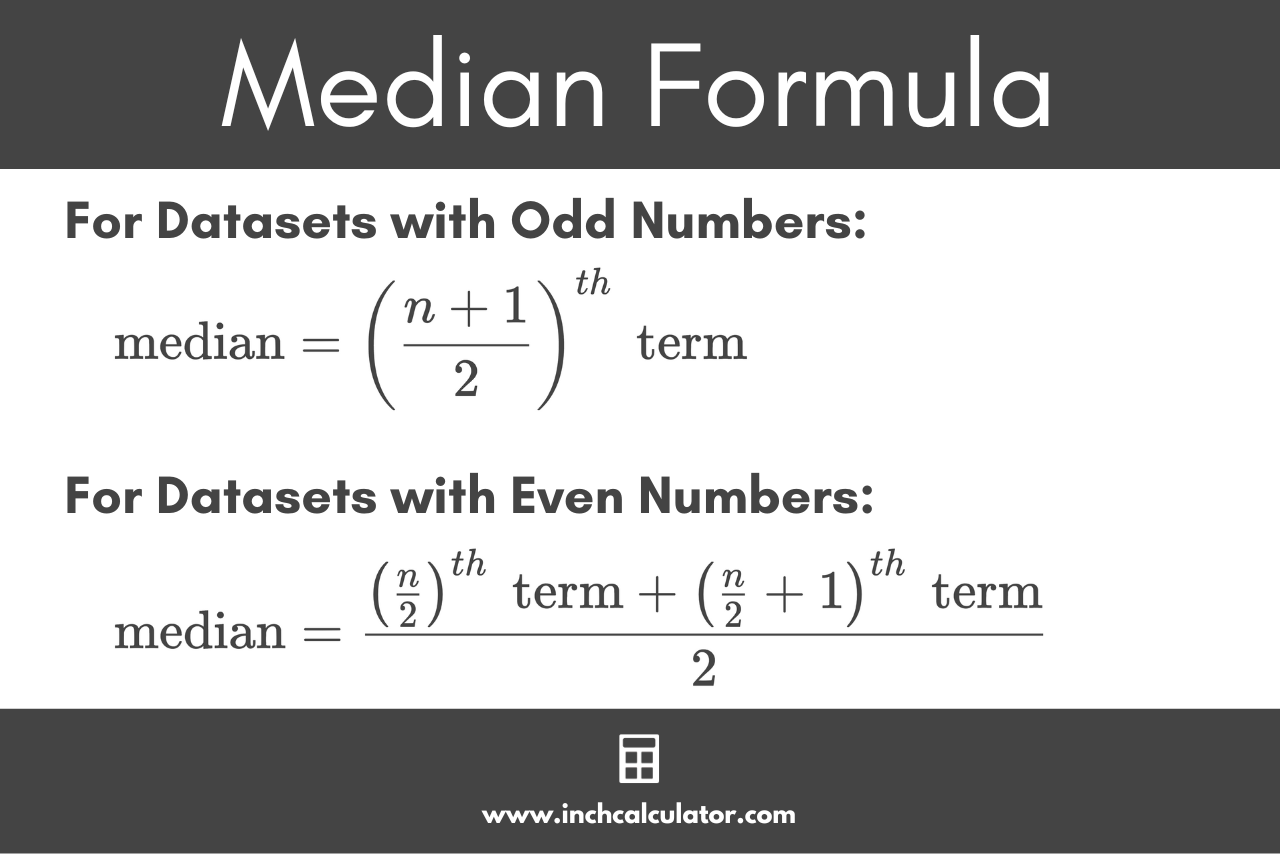
Different formulas are needed to find the median, depending on whether the dataset has an even or odd number of values. There are actually a number of different formulas to find the median, the most commonly used are shown here.[1]
Formula for Median for Datasets With Odd Numbers
You can find the median for a sorted dataset with an odd number of values using the following formula:
The median is equal to the (n + 1)/2th term in the dataset, which is equal to the number at the index of the count of the data n plus 1, divided by 2.
If the count of the numbers is odd, then the median is the number exactly in the middle of the data.
You can find the middle index of the numbers by adding one to the count and then dividing by 2. The result is the index of the median in the dataset.
Formula for Median for Datasets With Even Numbers
You can find the median for a sorted dataset with an even number of values using the following formula:
The median is equal to the n/2th term plus the (n/2) + 1th term, divided by 2.
If the count of the numbers is even, then the median is actually the average of the middle two numbers in the data. Find the two numbers in the middle by dividing the count by 2 to find the lower-middle index, then adding 1 to find the upper-middle index.
Then, add the numbers at the lower and upper-middle indices and divide the result by 2. The median for an even dataset is actually the mean of the middle two values.
For example, let’s calculate the median of the following numbers: [3,7,2,9,5]
Step 1: sort the numbers:
[2,3,5,7,9]
Step 2: count the numbers:
count = 5
Step 3: find the middle index:
median = x(5 + 1)/2
median = x6/2
median = x3
Step 4: find the number at the index 3:
[2,3,5,7,9]
median = 5
The median of the numbers above is 5.
Median vs. Mean
The median is a common example of what statisticians call a summary statistic, that is to say a quantity calculated from the data that summarizes its important aspects. Another commonly used summary statistic to describe numeric data is the mean.
Like the median, the mean is another measurement of the central tendency of a set of data. The mean is the average value of the data rather than the midpoint. It is equal to the sum of the data divided by the count of the numbers in the data.
So should you use the median or the mean to describe a set of data?
The median is a good way to find the middle of the data and ignore outlying data points that might skew the average result. It reflects the middle of the typical values of the data.
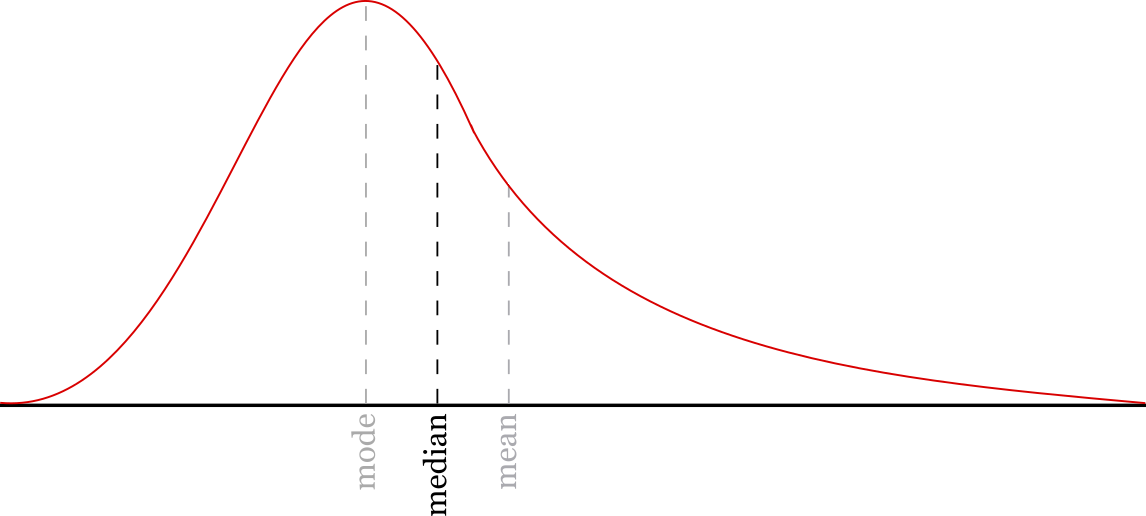
The mean might be more useful if the average value of the entire set of data is important. The statistical analysis of medians, for example calculating sampling variability, is also more difficult than the analysis of means.
But, it’s important to note that major outliers in the data can skew the mean. Consider the data: [3,4,5,6,91]
The average of this data is 21.8, and the median value is 5.
The median might do a better job of discarding those outliers and reducing the skew since it only considers the midpoint of the data. But, there are some cases when outlier values should be considered, making the mean a better representation of the data.
Our mean, median, & mode calculator offers even more statistical observations for your data.
Frequently Asked Questions
Is median the same as the average?
No, the median is not the same as the average. The median is the middle value of a dataset and is a way to express the midpoint of a set of numbers.
Is it more accurate to use mean or median?
Depending on how you want to use the data will determine if the mean or median is more useful. If you are wanting to describe the central tendency of the data, then the mean is more useful. If you are wanting to find the midpoint of the data, the median is the way to go.
Why would you use median?
You would use median to find the midpoint of the data and to see what values are higher than the midpoint and which are lower. You would also prefer the median if you are looking for typical values and are willing to exclude the influence of possibly atypically small or atypically large values.
Similar Statistics Calculators
References
- Hyndman, R. J. and Fan, Y., Sample quantiles in statistical packages, American Statistician, 1996, 50, 361-365. https://doi.org/10.2307/2684934