Mode Calculator
Find the mode of a set of numbers using the calculator below.
Results:
| Mode: |
|---|
Frequency Table:
| Value: | Frequency |
|---|---|
On this page:

Joe is the creator of Inch Calculator and has over 20 years of experience in engineering and construction. He holds several degrees and certifications.


How to Find the Mode
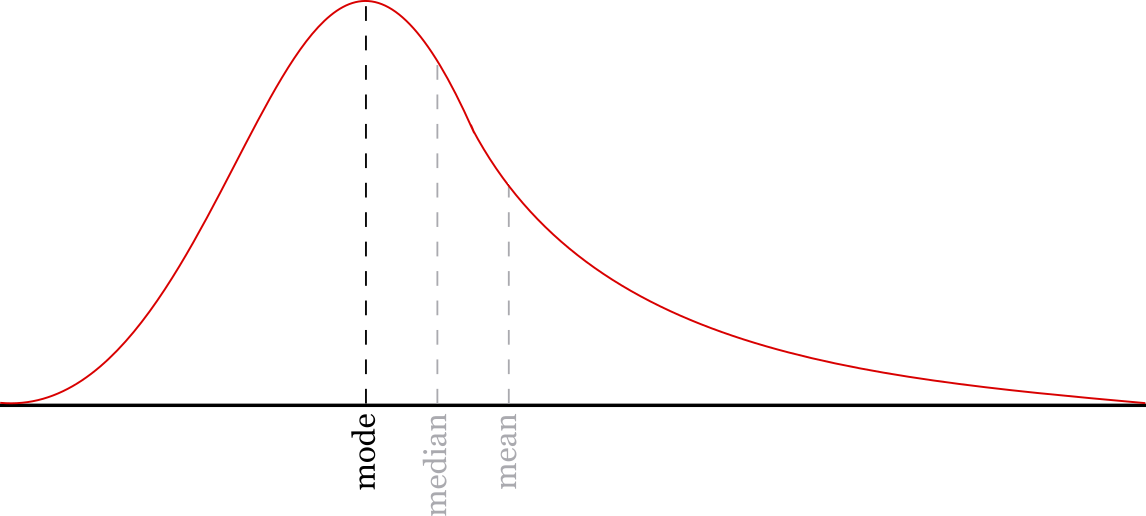
In statistics, the mode is the most frequently occurring value in a numerical set of data. The mode is the number that occurs most often or is repeated the most.
The mode is a commonly used summary statistic, and it describes the central tendency of the data.
The mode of a data set is the most frequently occurring number that arises at least twice. Thus, it is possible for a data set to have no mode at all if there are no numbers that repeat.
For example, given the set [3,5,3], the mode is 3 since it occurs twice.
However, given the set [2,4,7], there is no mode since all of the values only occur once.
It is also possible for a data set to have more than one mode if multiple values occur the same number of times. A set with one mode is referred to as a unimodal dataset, a set with two modes is a bimodal dataset, and a set with three or more modes is a multimodal dataset.
For example, given the set [3,5,3,5,7], the mode is both 3 and 5 since they both occur with the same frequency. This is a bimodal dataset.
Steps to Find the Mode
You can find the mode by counting the number of times each value in a set of numbers is repeated. The number that occurs with the highest frequency is the mode.
While uncommon, it is possible that multiple numbers might be repeated the same number of times. If multiple numbers are repeated the same number of times as the most commonly repeated number, they are also part of the mode.
Some datasets have no mode at all. If no numbers are repeated at all, then there is no mode.
So, to sum it up, there are three simple steps to find the mode:
- Step 1: count the occurrences of each number in the set
- Step 2: find the number or numbers that occur the most
- Step 3: that’s it – you found the mode!
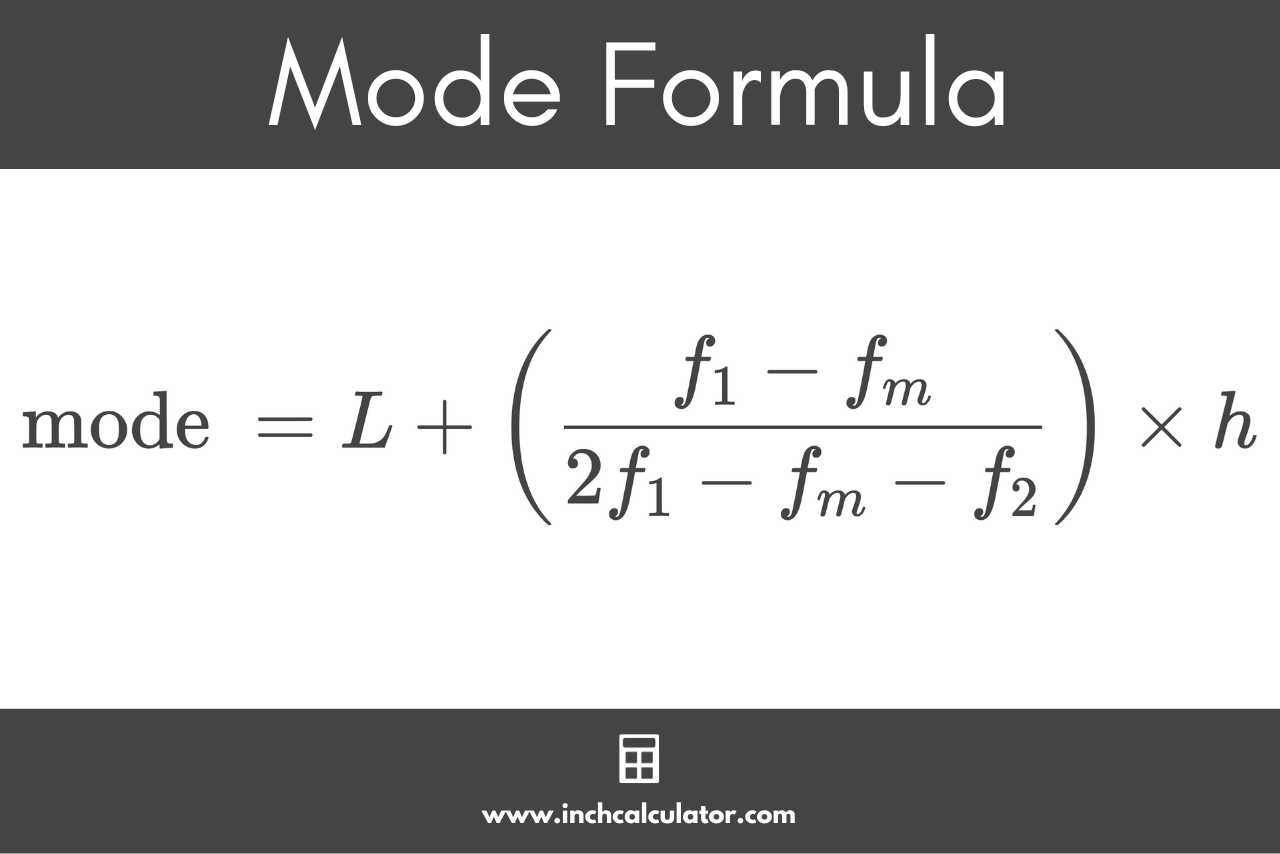
Mode Formula
The process above can be represented using the following mode formula:
Where:
L = lower limit of the modal class
fm = frequency of the modal class
f1 = frequency of the class preceding the modal class
f2 = frequency of the class succeeding the modal class
h = size of the class interval
Example: Set With a Single Mode
For example, let’s calculate the mode of the following numbers: [3,7,5,7,6,7,3]
Step 1: count the occurrences of each number.
| Value: | Frequency |
|---|---|
| 3 | 2 |
| 5 | 1 |
| 6 | 1 |
| 7 | 3 |
Step 2: find the number or numbers that occur most often.
Since 7 occurs the most in this set, the mode is 7.
Example: Set With Multiple Modes
For example, let’s calculate the mode of the following numbers: [2,6,5,2,6,4,7,4]
Step 1: count the occurrences of each number.
| Value: | Frequency |
|---|---|
| 2 | 2 |
| 4 | 2 |
| 5 | 1 |
| 6 | 2 |
| 7 | 1 |
Step 2: find the number or numbers that occur the most.
Since 2, 4, and 6 occur with the same frequency in this set, the dataset is multimodal, and the mode is 2, 4, and 6.
The mode is the least used statistical observation since mean and median are the most commonly used. Try our mean or median calculators.