Empirical Rule Calculator (68-95-99 Rule)
Enter the mean and standard deviation for a standard normal distribution to calculate the amount of data that will fall within 68%, 95%, and 99.7% of the mean using the empirical rule.
Results:
68% of the data is between
95% of the data is between
99.7% of the data is between
Steps to Solve:
Part 1: 68% of the data falls within 1 standard deviation of the mean
μ - σ = ?
μ + σ = ?
Part 2: 95% of the data falls within 2 standard deviations of the mean
μ - (2 × σ) = ?
μ + (2 × σ) = ?
Part 3: 99.7% of the data falls within 3 standard deviations of the mean
μ - (3 × σ) = ?
μ + (3 × σ) = ?
On this page:

Joe is the creator of Inch Calculator and has over 20 years of experience in engineering and construction. He holds several degrees and certifications.

Brian specializes in political science and statistics with several advanced degrees from Harvard.
How to Use the Empirical Rule
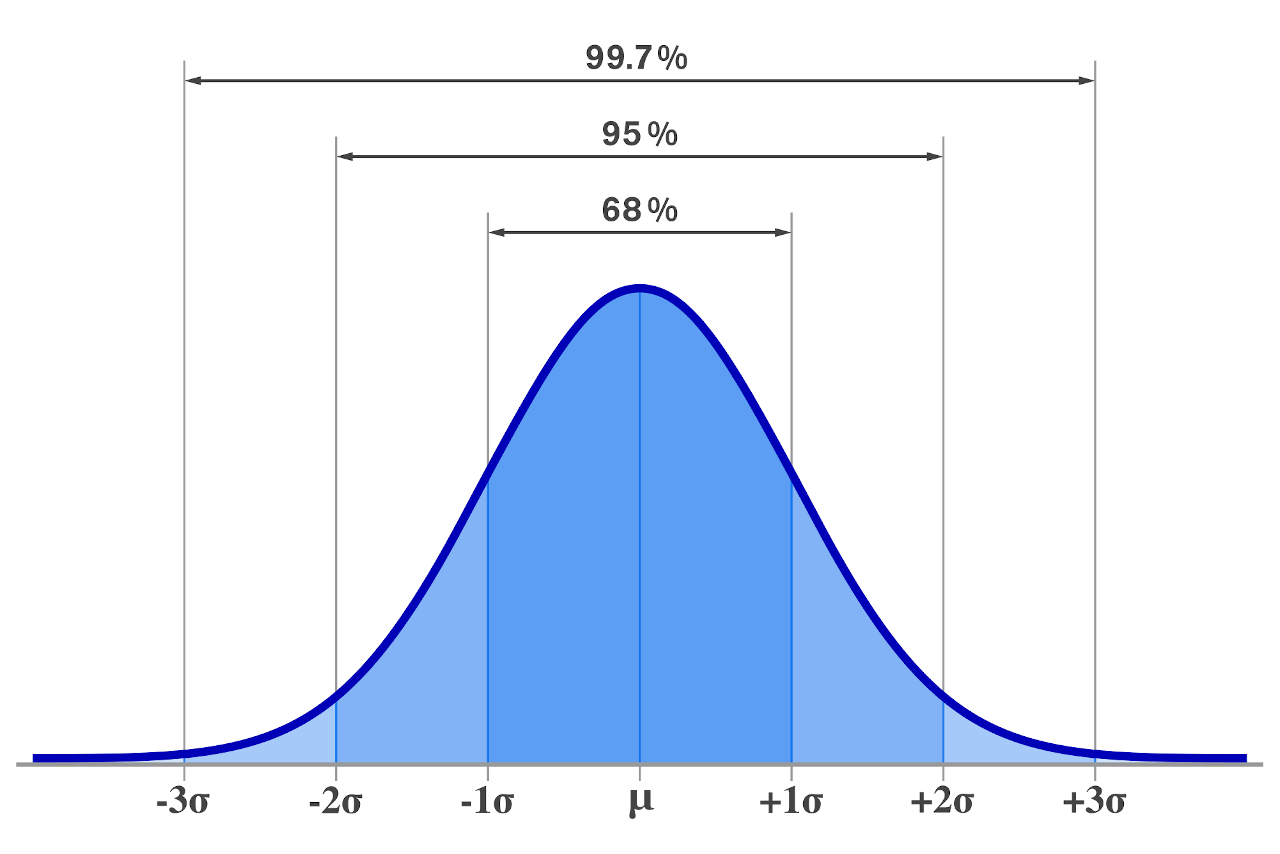
In statistics, the empirical rule states that 99.7% of data that is normally distributed will fall within three standard deviations of the mean. In addition, the rule states that 68% of the data will fall within one standard deviation of the mean, and 95% will fall within two standard deviations of the mean, as shown in the graph below.
Said a little differently, the empirical rule suggests that there is a 68% probability that an observation will be within one standard deviation from the mean in a dataset, a 95% probability that it will be within two standard deviations, and a 99.7% probability that it will fall within three standard deviations.
The empirical rule is also known as the 68-95-99.7 rule and is sometimes also called the three-sigma rule (3σ rule).
In a normally distributed data set (bell-shaped distribution), the distance from the mean in standard deviations is the z-score. For instance, a z-score of 2.0 is a 2σ distance from the mean.
Thus, the empirical rule can be used to estimate the percentage of the data between z-scores.
Key Takeaway
- 68% of the data falls within one standard deviation of the mean
- 95% of the data falls within two standard deviations of the mean
- 99.7% of the data falls within three standard deviations of the mean
If you’re just getting started with statistics, the mean is the average value of the data set and is often represented using the Greek letter mu μ. The standard deviation is a measure of the variability within the data and is represented using the Greek letter sigma σ.
Empirical Rule Formula
The empirical rule can be represented in three parts using the following formulas:
The first part of the rule states that 68% of the data falls between these two values:
μ ± (1 × σ) ≈ 68%
Thus, 68% of the data will fall between the mean μ plus or minus the standard deviation σ.
The second part of the rule states that 95% of the data falls between these two values:
μ ± (2 × σ) ≈ 95%
So, 95% of the data will fall between the mean μ plus or minus 2 times the standard deviation σ.
The third part of the rule states that 99.7% of the data falls between these two values:
μ ± (3 × σ) ≈ 99.7%
So, 99.7% of the data will fall between the mean μ plus or minus 3 times the standard deviation σ. The empirical rule is frequently used in forming confidence intervals, which aim to estimate the likely location of an unknown parameter.
For example, given a data set with a mean of 48 and a standard deviation of 13, let’s apply the empirical rule to find the range of the values above and below the mean that will contain 95% of the data.
Using the formulas above, the range that will contain 95% of the data is:
z = μ ± (2 × σ)
Substituting the mean and standard deviation in the formula is:
z = 48 ± (2 × 13)
z = 48 ± 26
This can be rewritten as the following formulas:
z = 48 – 26 = 22
z = 48 + 26 = 74
Thus, 95% of the data in this set will be between 22 and 74.
You might also be interested in our p-value calculator, which can find the percentage of values above or below a score rather than between scores.