CAGR Calculator
Calculate the compound annual growth rate using our CAGR calculator.
Results: Compound Annual Growth Rate
Growth in Value Over Time
On this page:

Joseph Rich holds a Master's degree in finance and a Bachelor's degree in economics. He specializes in economics and investing analysis.

Monica Greer holds a PhD in economics, a Master's in economics, and a Bachelor's in finance. She is currently a senior quantitative analyst and has published two books on cost modeling.

Laura started her career in Finance a decade ago and provides strategic financial management consulting. She has an MBA in Finance and a Bachelor's in Economics.
How to Calculate Compound Annual Growth Rate (CAGR)
The compound annual growth rate (CAGR) is the rate of interest accrued (i.e., earned) on not only the original investment but also on any previously accrued interest from a prior period. It is typically used to measure an investment’s historical rate of return, allowing the investor to forecast future returns.
There are many ways to calculate the CAGR, such as with the calculator above, the CAGR formula, a spreadsheet, or a financial calculator. All you need to know is the beginning and ending amount and the time period in years.
CAGR Formulas
This first CAGR formula can only be used for annual compounding. The CAGR formula for other compounding periods is explained later in this section.
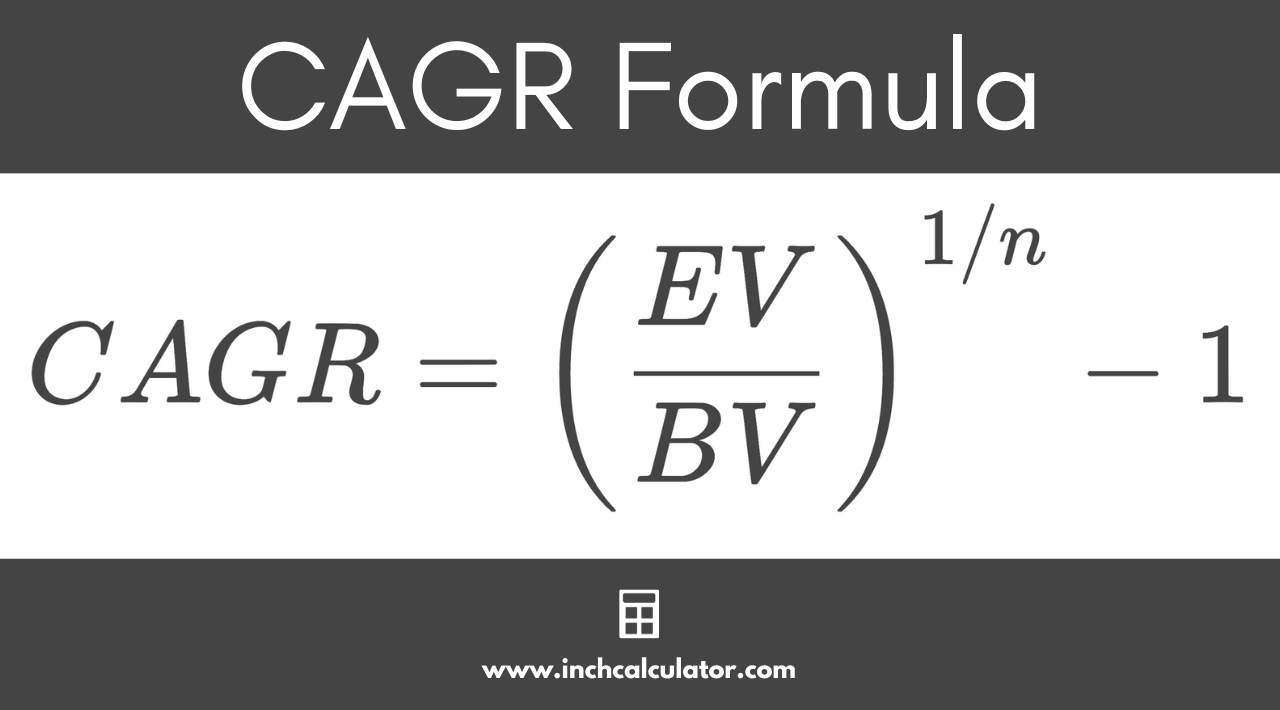
CAGR Formula with Annual Compounding
The formula to calculate CAGR with annual compounding is:[1]
Where:
BV = beginning value
EV = ending value
n = number of years
Thus, the compound annual growth rate is equal to the ending value EV divided by the beginning value BV to the power of 1 divided by the number of years n, minus 1.
Let’s use a real-world example. On January 3, 2017, the Dow Jones Industrial (DJI) was trading at $19,881.76. By December 31, 2021, it had increased to $36,338.30. What was the CAGR over this 5-year time period, assuming annual compounding?
This shows that the DJI increased at a rate of nearly 13% per year.
Now we want to see what happens if we change the compounding. To account for this, we will use the formula below.
CAGR Formula with Periodic Compounding
Where:
BV = beginning value
EV = ending value
C = compounding frequency per period
n = number of years
Using the same amounts from the DJI, what would the CAGR be if quarterly compounding (C=4) was used?
In this case, the CAGR is less because if there are more compounding periods per year, the CAGR must be slightly lower to reach the same ending value.
These two formulas are essentially the same. In the annual compounding formula, the C term is equal to 1, so it doesn’t need to be shown in the CAGR formula.
Simple vs. Compound Annual Growth Rate
The simple annual growth rate (SAGR) differs from the compound annual growth rate in that the growth is only calculated on the beginning value.
In the DJI example, the SAGR will need to be higher to achieve the same ending value because the SAGR does not include compounding.
Simple Annual Growth Rate Formula
Where:
BV = beginning value
EV = ending value
n = number of years
Continuing our example above, the simple annual growth rate for the same DJI example is calculated as follows:
Since the period started at $19,881.76, each period will need to be increased by $3,291.31 ($19,881.76 × 0.165544 = $3,291.31).
You could also confirm the periodic growth like this:
You can input the beginning balance and growth rates for both the SAGR and CAGR into our simple interest and compound interest calculators to confirm the same future value is obtained.
If you know the monthly payment, you can use our interest rate calculator to find the annual interest rate.
What is the Compound Annual Growth Rate Used For?
The Compound Annual Growth Rate is primarily used by investors to analyze how well an investment or portfolio has performed over a particular time period. Investors are then able to compare their performance to a particular benchmark.[2]
For instance, an investor might choose to compare the growth of an investment to the Dow Jones Industrial Average as their benchmark. If their portfolio’s CAGR consistently outperforms this benchmark, they are investing better than the market. They are underperforming if their CAGR is consistently lower.
It is important for investors to choose a benchmark that is comparable to their portfolio, to get a like-for-like comparison.
For example, if an investor is investing primarily in bonds, then a benchmark composed of stocks is not going to provide useful results. Also, if an investor is invested in stable value stocks, the NASDAQ, which is composed of technology and growth stocks, won’t provide useful results either.
For example, let’s say a value investor has chosen the Dow Jones Industrial Average as their benchmark. They started investing in 2017 with $10,000 and ended in 2021 with $19,500, and they didn’t make any buying or selling transactions during this time.
If we plug these numbers into the CAGR formula, we get the following:
In this case, the investor’s portfolio has outperformed the DJI. We calculated the DJI’s CAGR as 12.82% and the investor’s CAGR as 14.29%. If the investor made any contributions to the portfolio, we would not be able to compare the two.
These contributions would have increased the portfolio, and we would not be sure if it truly outperformed the benchmark or not.
The investor can also use the CAGR to analyze which individual stocks have outperformed or underperformed the benchmark. This allows the investor to make appropriate trading decisions that fit their risk level.
Why is CAGR Important?
As discussed in the previous section, the CAGR gives investors useful information regarding stock performance by calculating the CAGR on their portfolio and comparing it to similar benchmarks.
If a stock has been underperforming every year, the investor may decide to cut their losses and remove it from the portfolio in favor of another which has been overperforming.
Or, if their portfolio has been underperforming the benchmark for a while, they may decide to switch up their strategy entirely and outsource the stock-picking to mutual funds or exchange-traded funds (ETF).
On the other hand, if their portfolio is consistently beating the market, they can make the decision to reduce their risk if the market falls (risk-averse investors) or increase their risk if they believe they can continue outperforming the market (risk-seeking investors). Either way, the CAGR provides the necessary information to analyze stocks and portfolios better.
The CAGR is also important because it uses a compound rate, as opposed to a simple rate, as shown earlier. The compound rate is the true return and can therefore be compared to other forms of investments more easily.
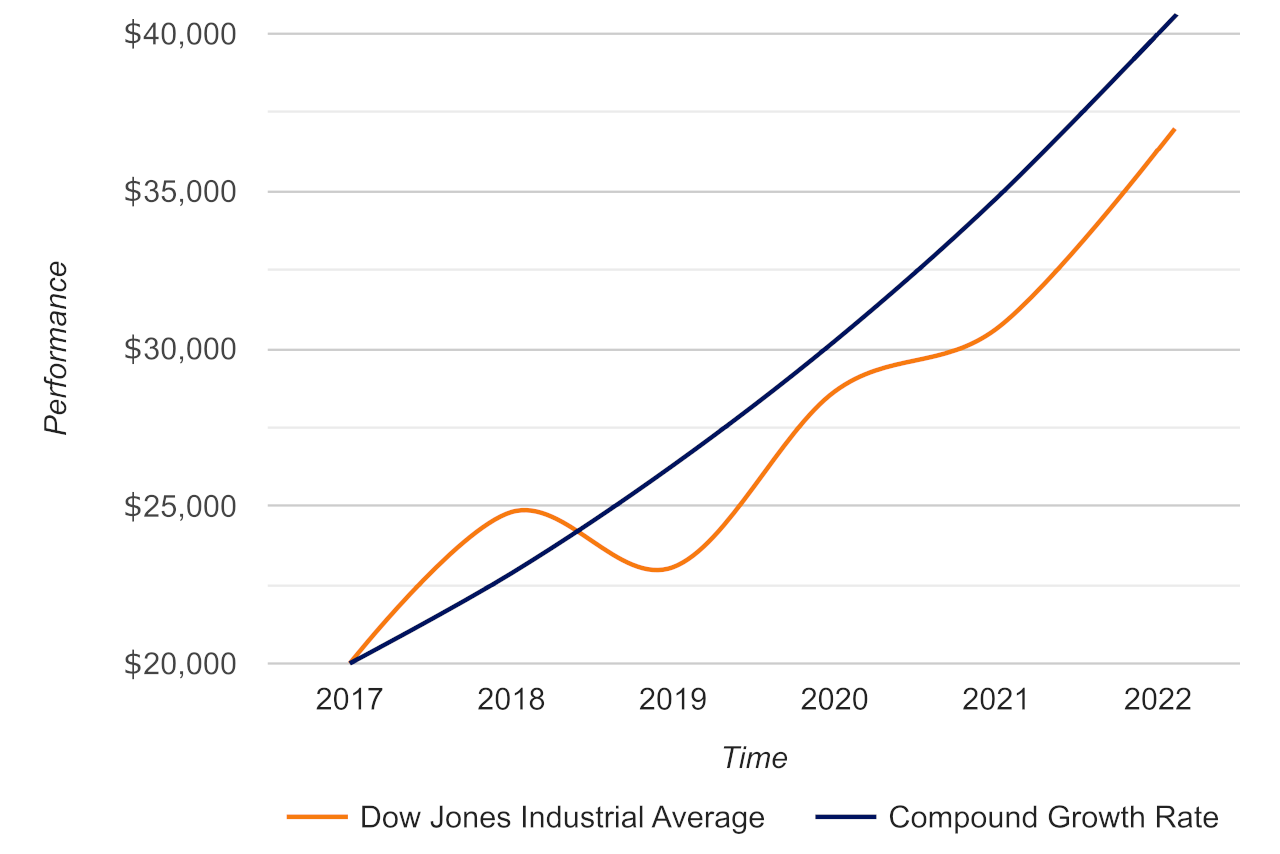
The simple growth rate of over 16% calculated earlier is misleading. If you were to invest at the same rate of 16.55% for five years, you would have more than doubled the investment, which is not what actually happened with the DJI over this timeframe.
For example, the chart below shows an investment accruing a compound growth rate of 16.55% vs. the Dow Jones Industrial Average. You can see that a compound growth rate of 16.55% results in doubling the investment, while the simple growth rate observed with the growth of the DJI did not.
To approximate how long it would take to double an investment, you can also use the Rule of 72. The approximate time it will take for an investment to double in value can be calculated by dividing 72 by the interest rate.
In our example, it would take roughly 4.349 years (72 ÷ 16.5544) to double an investment earning 16.55% per year using the Rule of 72. Note that the Rule of 72 should be used for quick approximations, the exact time to double at this rate is actually 4.525 years, which is calculated using a more complex formula (learn more on our doubling time calculator).
Pros and Cons of Using CAGR
The two pros of using the CAGR were discussed in the previous section. First, it allows investors to make important decisions regarding their portfolios and the components of their portfolios.
Second, since it uses a compounding rate, it provides the true growth rate over the time period since it accounts for returns on accrued interest or growth, versus a simple growth rate which results in higher returns when accrued growth is factored in.
There are three cons of using CAGR.
First, it assumes constant growth each year.[3] For example, in the table shown above, each year the DJI increased by 12.2451%. We know this is not accurate; the graph above illustrates the volatility in performance over time.
Some years, it may have increased by 20% or 30%, while some years it may have stayed flat or even declined.
This is due to the risk inherent in the investment. If there was no risk, then each year it would increase by the same amount. There is no investment out there that guarantees a specific rate of return each year. The higher the risk, the higher the expected return. Other external factors (e.g. supply and demand, inflation, & other economic factors) also play a role here and contribute to the risk of an investment.
The second con of using the CAGR is that it is unable to account for trading decisions in the portfolio. We briefly discussed this earlier. In our example, where our portfolio increased from $10,000 to $19,500, we needed to mention that there was no buying or selling during that time.
If there were, it would muddy the true results and not allow us to accurately compare the portfolio to the benchmark. For example, what if $5,000 was added to the portfolio over this time?
Then we could say that most of the growth was really due to just the additions to the portfolio instead of growth within the portfolio.
Finally, CAGR does not take the amount of risk into account.[4] If two investments had a 5-year CAGR of 10%, how would we know which one is better? The answer lies in the risk.
Investors use different ways to measure risk, but the most common ones are either the standard deviation or beta. Both standard deviation and beta measure the volatility of an investment. If there are higher swings in one stock or the other, the standard deviation and beta will also be higher.
Beta is a measure of volatility relative to other investments, while standard deviation is a measure of the volatility in the stock market over time without regard to other investments.
An investor would prefer to invest in the stock that has the lower standard deviation and beta, assuming the CAGR is the same between them.
CAGR vs. IRR
The CAGR measures the growth rate of a portfolio, whereas the Internal Rate of Return (or IRR) measures whether an investment in capital expenditure makes financial sense for a business. Both assess investments, but they are used for different purposes.
The CAGR can be used for an investment that grows over time. As has been discussed throughout, the easiest example is the stock market. You invest in a stock with the expectation that the value will increase over time.
This will give you a return of capital appreciation and dividend payments (for stocks that distribute dividends).
The CAGR needs to be compared to a benchmark in order to judge its success. For example, if your portfolio earned 15% over the prior year, that may seem like a great year. Earning 15% per year over the long run is a great return that few investors can attain.
The IRR analysis is used in capital budgeting to determine the rate of return on a project or capital expenditure. The IRR that is calculated from a stream of payments needs to be higher than the business’s IRR for it to be considered.
The IRR is the rate that sets the present value of a stream of payments to $0. With a business project or capital expenditure, there is typically an initial outflow of cash followed by a stream of inflows of cash.
The IRR that the business uses will need to be what other projects have yielded or the return that the owners demand.
Let’s set up an example for a business to see how it works. An addition of a new machine costs $10,000 upfront but provides savings of $3,000 per year for four years, at which point it will be scrapped. What is its IRR?
By using our IRR calculator, you can find that the IRR is 7.71%. The calculator discounts each cash flow by the IRR to obtain its present value. Once added to the -$10,000 initial cash flow, the total is $0.
If the company requires an IRR of 10%, then this project should not be pursued. If the required IRR is 5%, then the business should proceed with adding the new machine.
Frequently Asked Questions
What does the CAGR tell you?
CAGR is the compound annual growth rate, or the average annual growth rate of an investment over a period of time, accounting for compound interest. It’s used to measure an investment’s historical rate of return and helps investors choose investments that fit their risk level.
Does CAGR include dividends?
The CAGR of an investor’s stock or stock portfolio does typically include dividend payments for stocks that distribute dividends.
Does CAGR account for inflation?
CAGR does not account for inflation, however, you can use the following formula, (1 + Stock Return)/(1 + Inflation) – 1, in order to find the inflation-adjusted return of a stock for a given year.
Is CAGR good for forecasting?
CAGR tells you an investment’s historical rate of return and can therefore be used to forecast future returns on an investment. However, CAGR is an average annual rate of return and does not guarantee future performance or tell you the exact return an investment will achieve in any given year.
References
- Chan, E., Harvard Business School Confidential: Secrets of Success, John Wiley & Sons, August 31, 2009, 185. https://www.google.com/books/edition/Harvard_Business_School_Confidential/wF4sbVUGz08C
- Wendorf, M., Compound Annual Growth Rate (CAGR), Seeking Alpha, https://seekingalpha.com/article/4516791-compound-annual-growth-rate-cagr
- Kavanagh, R., https://www.businessinsider.com/personal-finance/cagr, Business Insider, https://www.businessinsider.com/personal-finance/cagr
- Wayman, R., Compound Annual Growth Rate: What You Should Know, Investopedia, https://www.investopedia.com/investing/compound-annual-growth-rate-what-you-should-know/