Cross-Price Elasticity Calculator
Use our cross-price elasticity calculator to calculate the elasticity in the change in the demand for a good, given the change in price of a different good.
Results: Elasticity
Interpretation:
On this page:

Monica Greer holds a PhD in economics, a Master's in economics, and a Bachelor's in finance. She is currently a senior quantitative analyst and has published two books on cost modeling.

Laura started her career in Finance a decade ago and provides strategic financial management consulting. She has an MBA in Finance and a Bachelor's in Economics.
How to Calculate Cross-Price Elasticity
Cross-price elasticity is a concept used to describe how changes in the price of one product will affect the demand for another product. Unlike the price elasticity of demand and price elasticity of supply, cross-price elasticity refers to the relationship between the price of different goods.
The prices (and quantities sold) of many products are heavily connected to the price of other products because, although they are usually sold separately, these products may be related in some way. Some are known as complements, others are known as substitutes, and some are unrelated. These are described in more detail below.
Complements in Consumption
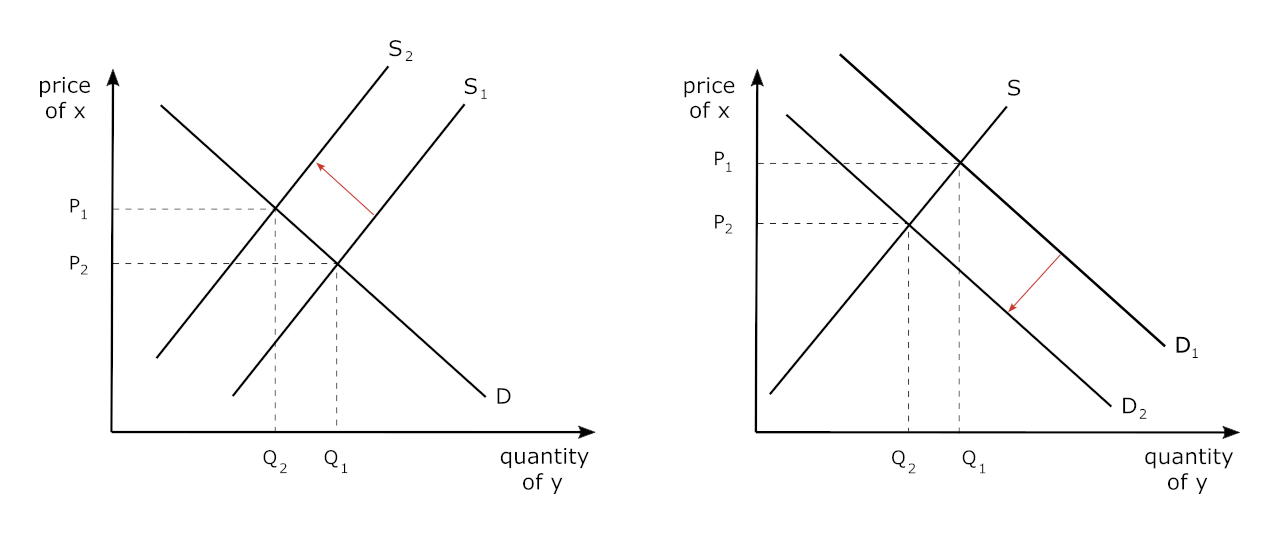
There are quite a few examples of products with high levels of cross-price elasticity. For example, when the price of buying a bicycle significantly increases, fewer people will choose to purchase bicycles, and the demand for bicycle helmets will go down. In this case, bicycles and helmets will have a high, negative cross-price elasticity (greater than unity in absolute value) since these are complementary goods. This scenario is illustrated in the graphs below.
On the left, we see the market for bicycles (good x), which was in equilibrium at the intersection of supply and demand at P1 Q1. However, let’s say that the price of an input into the production of bicycles increases so that the supply curve shifts to the left, thus increasing price (to P2) and decreasing the quantity of bicycles sold to Q2.
Since these are complements, the increase in the price of bicycles results in a decrease in the demand for bicycle helmets (good y), and the price of helmets as well. This is displayed on the right:
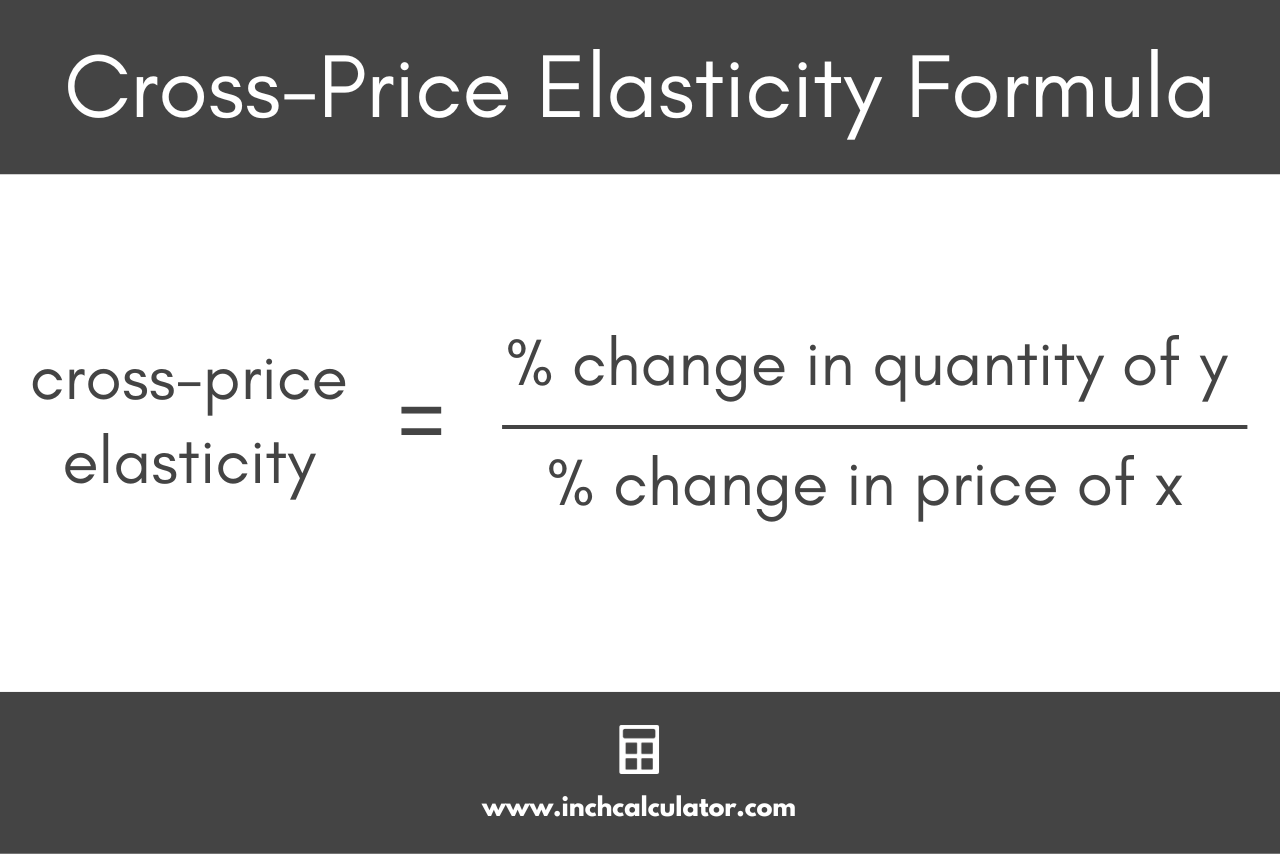
Cross-Price Elasticity Formula
The formula to calculate the cross-price elasticity of demand is given by:
Eyx = % change in quantity of good y / % change in price of good x
% change in quantity supplied = Q1 – Q0 / (Q1 + Q0) ÷ 2 × 100
% change in price = P1 – P0 / (P1 + P0) ÷ 2 × 100
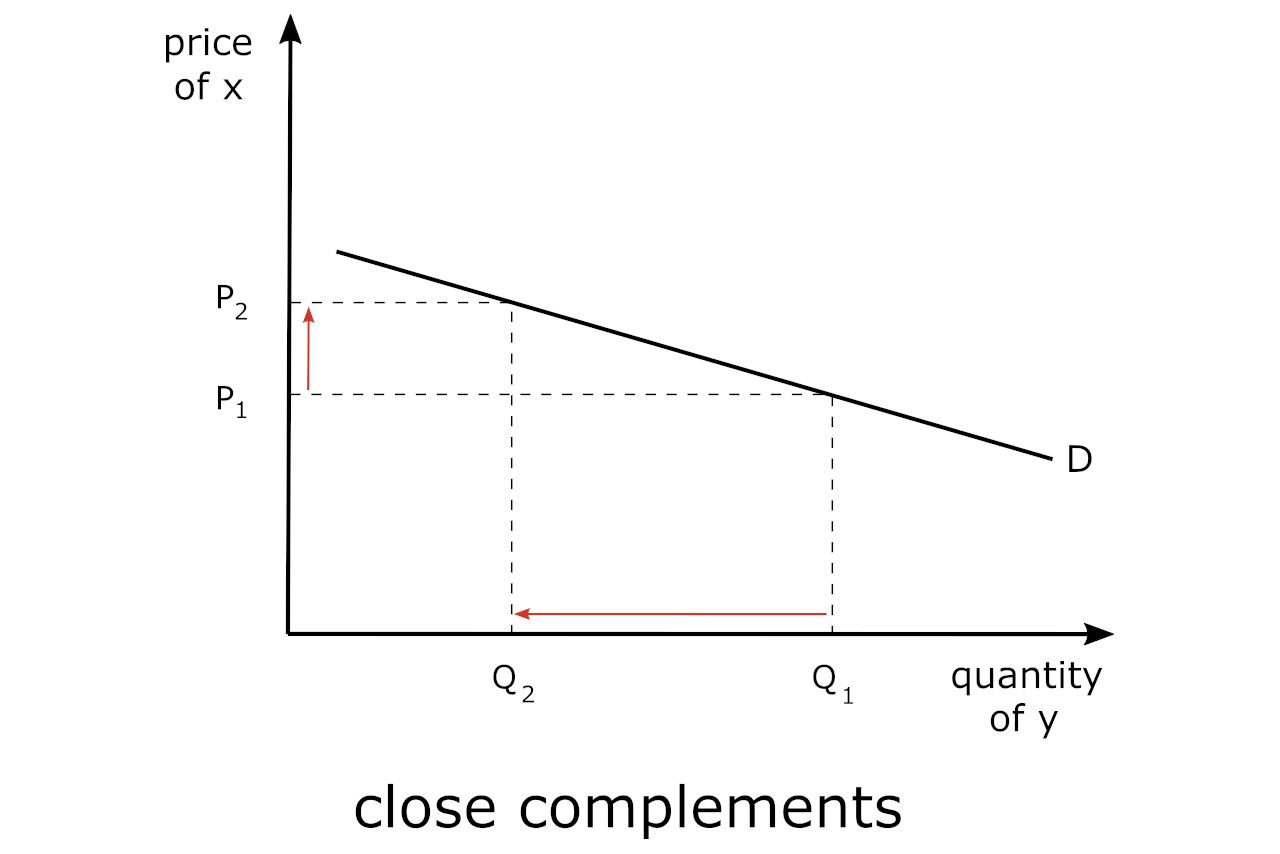
Numerical Example: Bicycles and Helmets – The Case of Close Complements
Let’s say that the price of bicycles was $100 and increased to $120 – a 20% increase, which resulted in the quantity of helmets traded in the market to decrease from 60 to 40, a 33% decrease. Using the formula provided above, we would find that the Eyx would be
Eyx = -33% / 20%
Eyx = -1.65
It is important to point out that the actual formula for the cross-price elasticity is a function of the change in the quantity of the related good (in this case y) from a change in the price of the own good (x). This is illustrated in the chart below.
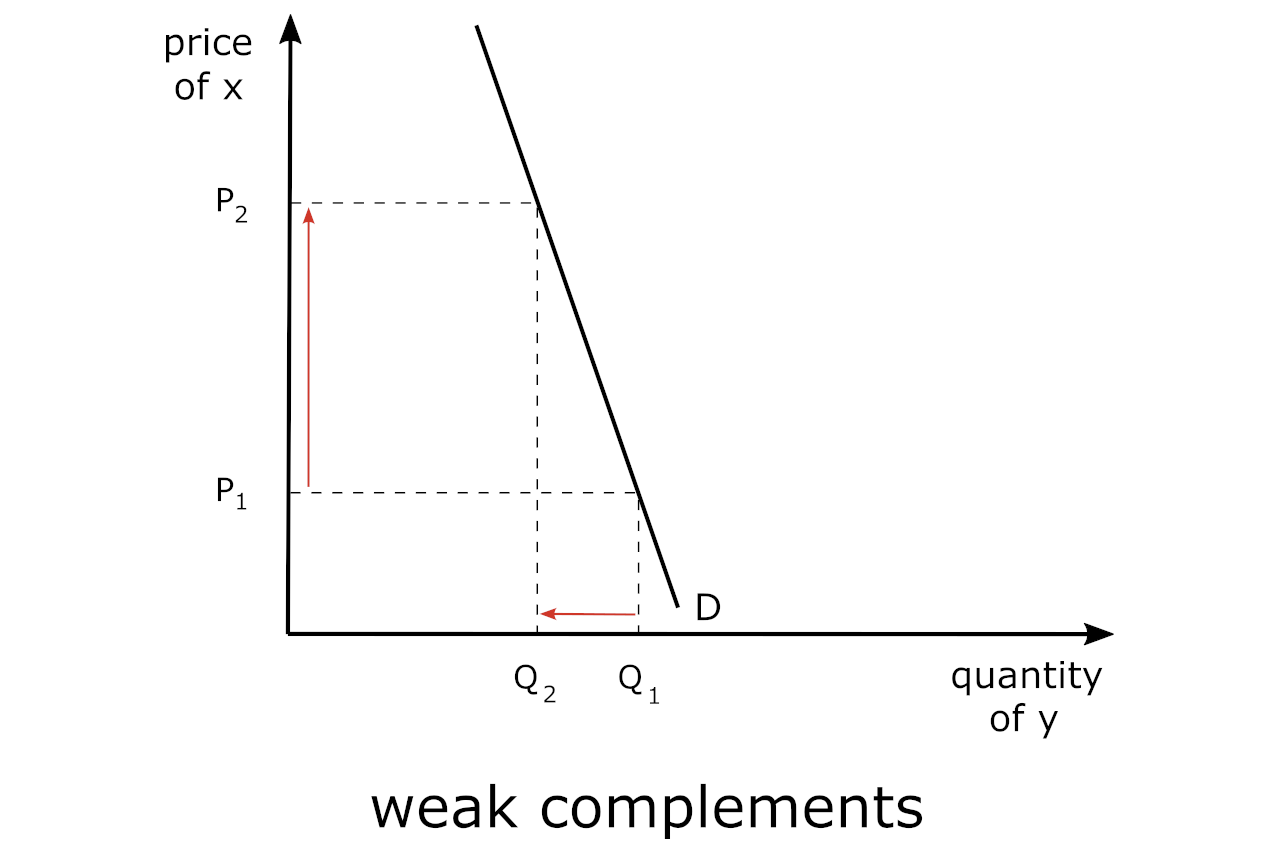
Close vs. Weak Complements
There are goods that are complements, but not all goods have the same degree of “complementarity”. For example, since printers require ink to print documents, an increase in the price of ink cartridges (good x) does not necessarily yield a similar, or commensurate, decrease in the number of printers that require ink cartridges (good y), since people may switch to purchasing other types of printers that do not require ink cartridges.
So, in this case, we would be showing the case of “weak” complements, which is shown in the graph below:
As such, we would expect that the cross-price elasticity of demand is not only negative but also between -1 and 0, i.e.:
-1 < Eyx < 0
Substitutes in Consumption
On the other hand, an increase in the price of Coke would likely increase how much Pepsi that people buy. In this case, the elasticity coefficient would be positive, thus indicating that these are substitute goods. These would be close substitutes.
While we could go through the same exercise as above (i.e., showing what transpires in each of the markets for the substitute goods, we can cut straight through to showing the impact of a change in price on one good (y) on the quantity of the related good (x) on one graph.
The formula is essentially the same, except now the elasticity coefficient is positive in sign, so that:
Exy = % change in quantity demanded of x / % change in price of y
Below we are showing the graph for goods that are close substitutes in consumption – such as Coke and Pepsi.
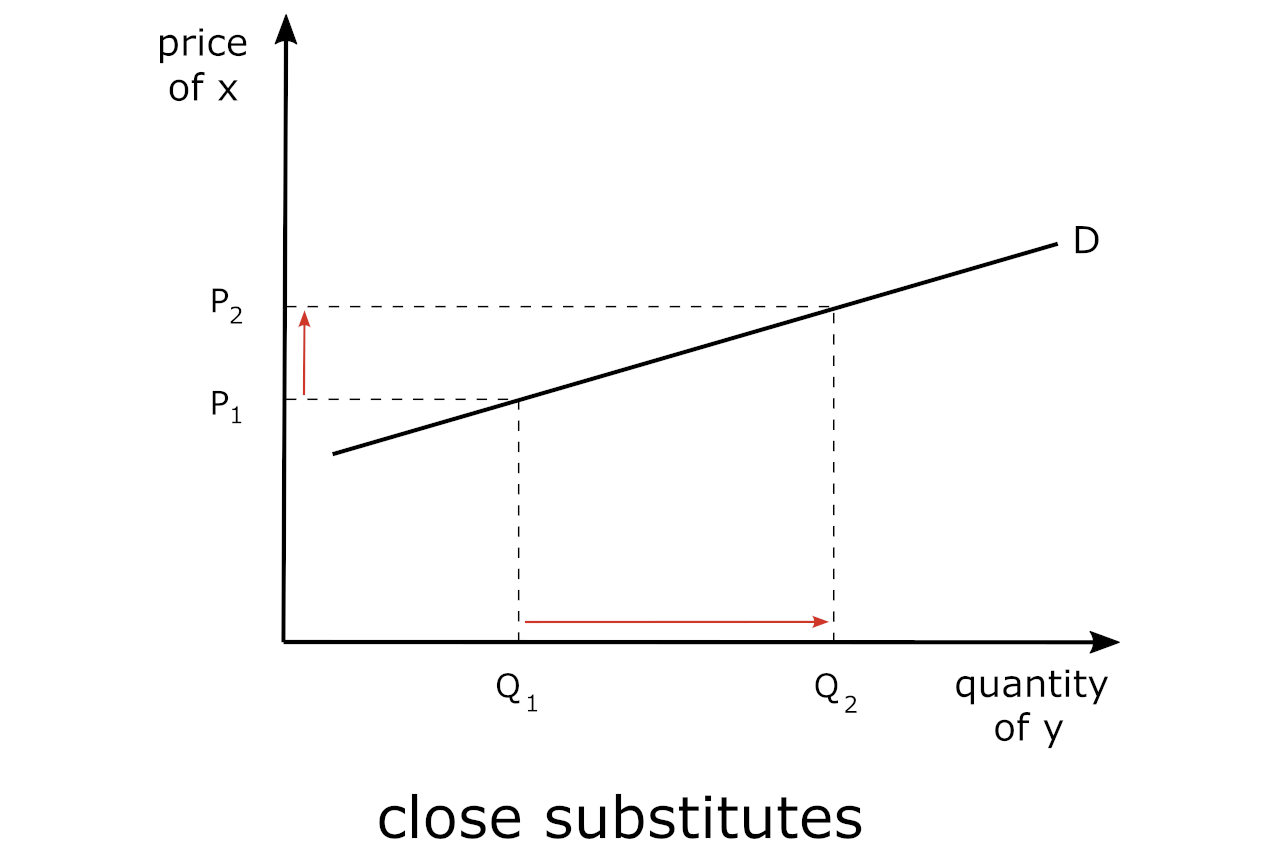
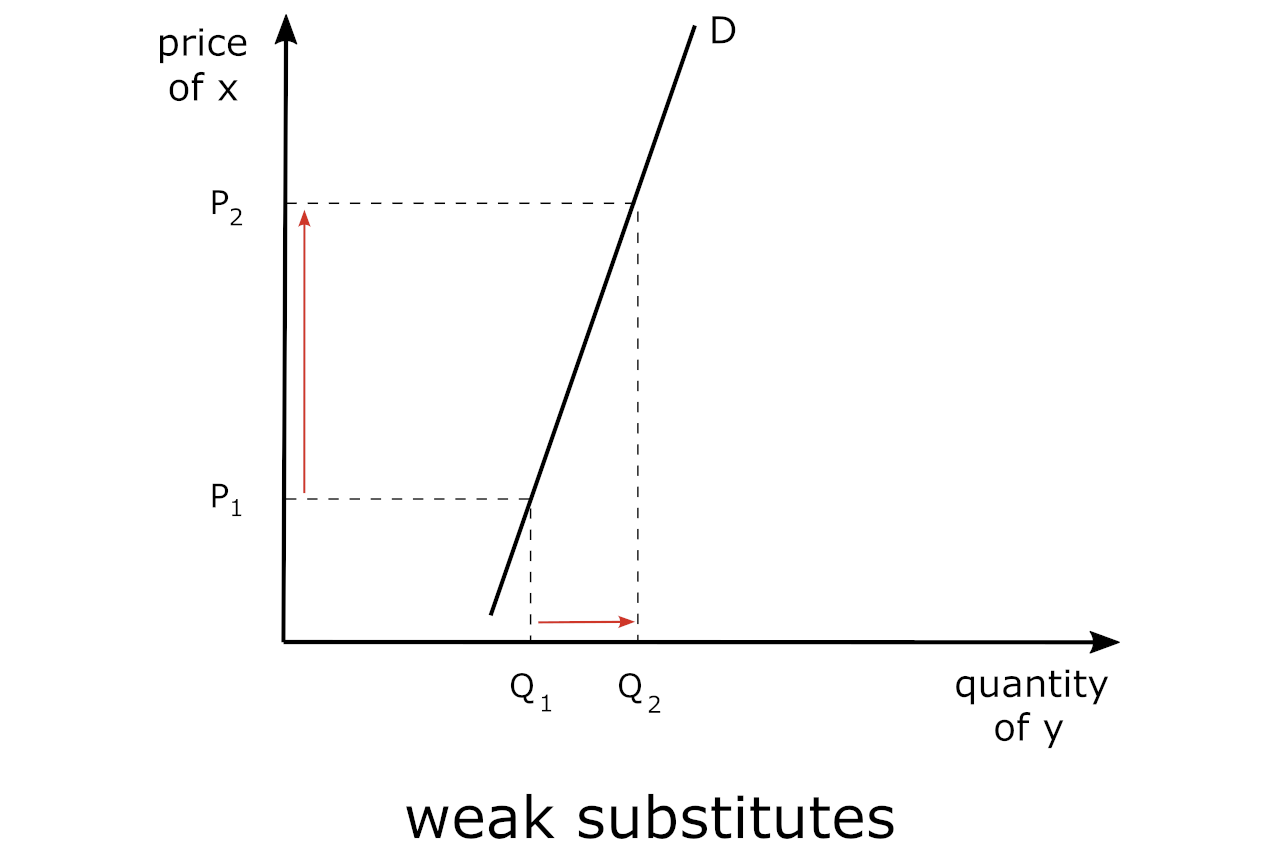
Close vs. Weak Substitutes
On the other hand, we could say that brand-name soda vs. generic soda, and the various products (i.e., colas, orange drinks, clear drinks, red drinks, etc.) constitute weak substitutes since there are so many other options. In other words, the lack of specificity yields “weak” substitutes in this category.
A more simple illustration is presented here – in the case of weak substitutes – such as tea and coffee. If the price of coffee increases, then some consumers may switch to tea; however, if most consumers prefer coffee over tea, then the increased demand for tea may be minimal, hence, they are “weak substitutes”.
In the case of “close” substitutes, we need to say within the purview of a specific product – coffee – and we could use the example of Starbucks vs. Costa Coffee.
We could go on to discuss these two companies, but I think that we want to focus on getting the message across, and an understanding of, what dictates “weak” vs. “close” in the case of both complements and substitutes.
There are products that are related in some way; that is, a change in the price of one good has an impact on the demand of the related good. This, of course, depends on the nature of the relationship between the two goods.
We have presented an analysis of goods that are complements and those that are substitutes. In general, goods that have a negative cross-price elasticity of demand are complements, while those with a positive cross-price elasticity of demand are substitutes.
However, we have delved deeper into each of these, and presented examples of “weak” vs. “close” – and explained how the actual cross-price elasticity of demand could indicate the degree of the relationship between the goods, which depends upon the magnitude of this coefficient (Exy).