Markup Calculator
Use our markup calculator to calculate the markup, gross profit margin, and profit. Enter any two fields to solve the remaining fields.
Results:
| Markup: | 100%
|
| Profit: | $100.00
|
| Gross Margin: | 50%
|
On this page:

Andrew holds a Bachelor's degree in Finance and a Bachelor's degree in Political Science from the University of Colorado and specializes in finance, real estate, and life insurance.

Monica Greer holds a PhD in economics, a Master's in economics, and a Bachelor's in finance. She is currently a senior quantitative analyst and has published two books on cost modeling.
How to Calculate Markup
Calculating markup is crucial for any business that wants to set profitable prices and keep pace with its competitors. Markup calculations are used on a regular basis and should be revisited by key decision-makers at least once every quarter.
Luckily, calculating markup is something that is actually much easier than you might assume–the only two numbers you need are cost and revenue. In this guide, we will help you learn how to calculate markup and also answer questions you may have.
What is Markup?
One of the first rules of business is in order for a business to generate a profit, it must have revenue that is greater than its costs.
While some businesses, particularly startups and other businesses in their early stages, can go quite a while before needing to make a profit, all businesses should strive to eventually be profitable and make a return on their investment.
Taking a close look at a business’s markup is a great way to understand the dynamic relationship between revenues and costs. The markup formula (as we explain below) is very easy to use–all you need is the business’s revenue and corresponding cost figures.
There are many different ways that a business can apply its markup calculations. In some cases, it may want to look at the markup for a single item that it is selling.
This can make it easier for the business to accurately identify which items are the real money makers and which items are not particularly profitable. It can also make it easier for the business to compare itself to its competitors.
Additionally, markup can be applied to the entirety of the business. When a business is able to increase its markup without sacrificing revenue, then its total profitability numbers will inevitably be much higher.
Keeping these ideas in mind, let’s take a closer look at how a business can calculate markup.
Markup Formula
To calculate markup, you need a business’s revenue and its costs, which can usually be found on the organization’s monthly, quarterly, or annual income statement.
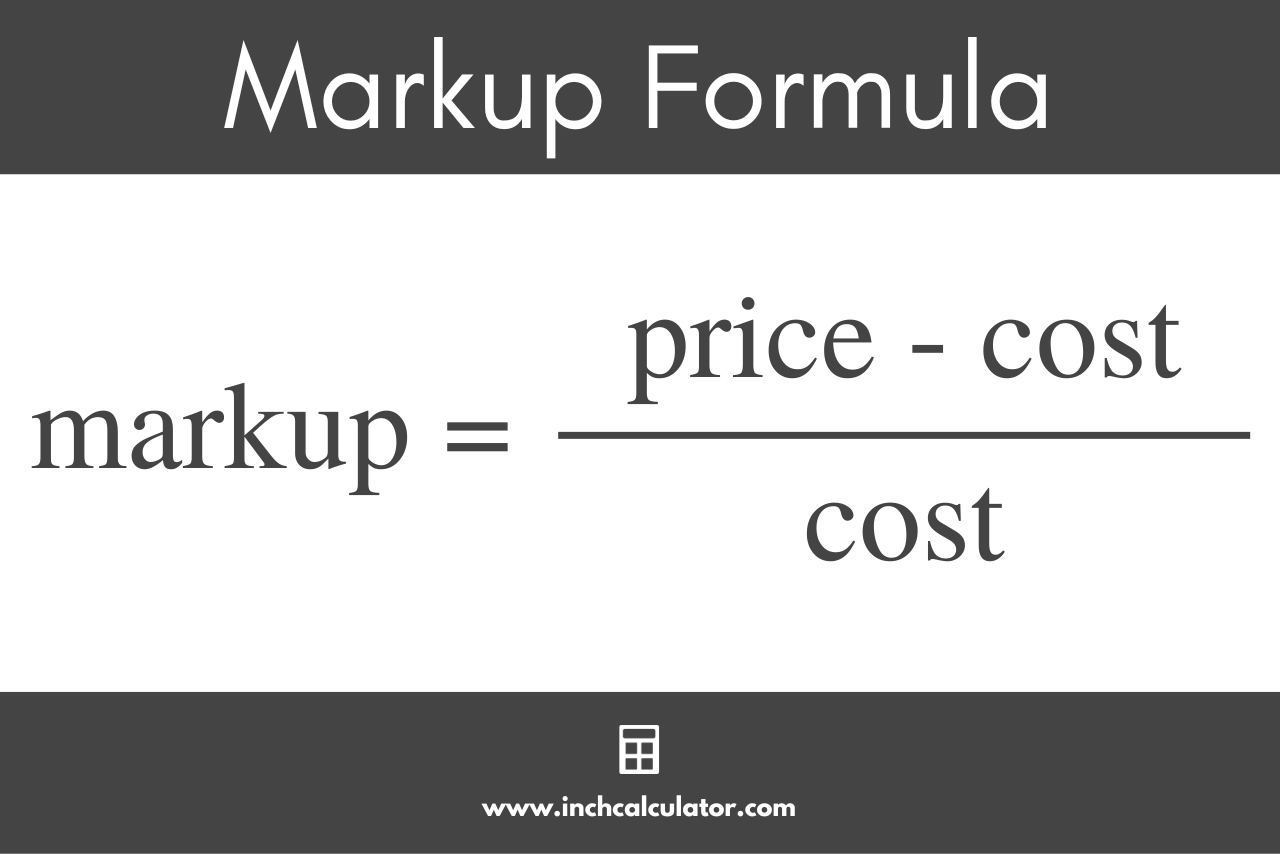
Once you have these figures in hand, you can use the following formula:
markup = revenue – cost / cost
Thus, the markup is the profit divided by the cost of goods sold.[1]
For example, suppose a company generated $10,000 of revenue while accruing $8,000 worth of expenses:
markup = $10,000 – $8,000 / $8,000
In this example, the final markup figure would equal 0.25. Whether or not this is “good” for a company will depend on several different factors, including the markups that are standard for the industry and other components of a company’s financials.
There is no universal answer to the question “what is the ideal markup for a business?” but using this calculation can still make it easier to determine if the company is moving in the right direction.
How to Express Markup as a Percentage
In many cases, businesses and other relevant decision makers will want to look at markup in terms of a percentage, rather than as a decimal or fraction. To calculate the markup as a percentage, you use the following formula:
markup percentage = revenue – cost / cost × 100%
So, to express the markup as a percentage, simply multiply it by 100%.
Using the same numbers as before (revenue of $10,000 and cost of $8,000), we can then make the following calculation:
markup = $10,000 – $8,000 / $8,000 × 100%
markup = 0.25 × 100%
markup percentage = 25%
As you can see, this formula results in what is essentially the same answer but expressed as a percentage.
Markup vs. Gross Margin
Markup and gross profit margin are two financial figures that are often compared to one another. Both of these figures, after all, represent the relationship between a company’s revenue and costs and can be used to determine the ideal pricing model or compare a company’s financials to a competitor’s.
However, these two terms should not be used interchangeably. Though the inputs for both gross profit margin and markup will be the same (revenue and cost), the formulas used for these metrics are different.
Let’s stick with the numbers we have already been using: $10,000 in revenue and $8,000 for cost.
Gross Profit Margin Formula
You can plug them into the gross profit margin formula, which is:
gross profit margin = revenue – cost / revenue
Let’s stick with the numbers we have already been using: $10,000 in revenue and $8,000 for cost. In this case, calculating gross profit margin would look like this:
gross profit margin = $10,000 – $8,000 / $10,000
gross profit margin = 0.20 = 20%
As you can see, this produced a different result than the markup formula, which is why these two metrics cannot be used interchangeably.
Gross Profit Formula
On a financial report, you might also encounter the term “gross profit.” This is different from the gross profit margin. Rather than using a ratio, as our previous two formulas did, all you need to calculate gross profit is simply subtract the cost from the revenue.
gross profit = revenue – cost
Let’s calculate the gross profit using the values from the examples above.
gross profit = $10,000 – $8,000
gross profit = $2,000
The variables we have been using produce a markup of 25%, a gross profit margin of 20%, and a gross profit of $2,000, but whether these figures should be considered good or bad will depend entirely on the specific situation of the business. You can also use our margin calculator to calculate these figures.
Cost-Plus Pricing
By now, you might be wondering why businesses care so much about calculating markup and related financial figures. One of the main reasons is that understanding these figures can help them develop a pricing model that is both profitable and competitive.
There are several different strategies that businesses can use to set their prices. One common strategy is the cost-plus pricing model, which is also frequently referred to as markup pricing.
Cost-plus pricing accounts for the cost of the product, labor, and overhead such as sales commissions and then adds a markup percentage to arrive at the final price.
When using the cost-plus pricing model, businesses will use a fixed percentage (say, 25%) that is added directly to the cost. This ensures that if the company is able to sell its product, it will not only break even but also generate a predictable level of profitability.
Suppose it costs a company $100 to produce a widget and, using the cost-plus pricing model, the company wants to sell that widget with a 25% markup.
In order to determine the final price, you will then need to use the following formula:
price = cost × (1 + markup)
For example, let’s calculate the cost-plus pricing for a markup of 0.25.
price = $100 × (1 + 0.25)
price = $125
So, in this case, the widget will be sold for $125, which will generate $25 in profit for every widget sold. In reality, the numbers you are working with will not always be this straightforward, but the math will always be the same.
Average Markup by Industry
In order to contextualize gross profit margin, markup, and other related numbers, it is important to look at a company’s industry.
Generally, companies operating in industries that rely on the use of physical goods will have lower markups and gross profit margins than companies that rely on the use of non-physical goods (such as services or intellectual property).
Across all industries, the average gross profit margin is about 36% and the average net profit margin is about 5%. On the higher end of the spectrum, banks (99%), healthcare companies (56%), and software companies (58%) generate substantial gross profit margins (this is different from net profit margins).[2]
On the lower end of the spectrum, automakers (9%), packaging and container companies (22%), and general retailers (24%) generate notably tighter gross profit margins.
Additionally, as companies grow and mature, their markups and profit margins are likely to change, which is why it is not only important to account for industry, but also the company’s stage in the broader business cycle.
Understanding and Applying Markup
By learning how to calculate markup, businesses will be able to easily compare themselves to their most direct competitors and adjust their pricing strategy accordingly.
But in order for the application of any markup, gross profit, or gross profit margin to be useful, businesses need to ensure they are working with the right figures (revenue and cost) and are comparing themselves to the right alternatives.
An important consideration when evaluating margin and markup is the implicit cost. The markup and margin formulas above include the explicit costs, but do not factor in the opportunity cost.
For example, if you own and work at a grocery store and generate revenues of $100,000 per year and costs of $80,000 (all costs, not just COGS), your profit is $20,000 a year.
However, if you had the opportunity to work in another capacity and earn $50,000, then you actually have a $30,000 loss from being at the grocery store. In other words, the implicit cost (i.e., opportunity cost) needs to be considered when assessing the health of the business.
References
- Accounting Tools, The difference between margin and markup, July 11, 2022, https://www.accountingtools.com/articles/what-is-the-difference-between-margin-and-markup.html
- CFO Hub, What is a Good Gross Profit Margin?, https://cfohub.com/what-is-a-good-gross-profit-margin/