BMI Calculator
Enter your height and weight to calculate your BMI and body mass index classification. Plus, see the weight ranges for your height to reach a target BMI.
Results: Body Mass Index (BMI)

BMI Classification Weight Ranges:[1]
| BMI Classification | Weight Range |
|---|---|
| underweight (< 18.5) | |
| normal weight (18.5 - 24.9) | |
| overweight (25.0 - 29.9) | |
| class I obesity (30.0 - 34.9) | |
| class II obesity (35.0 - 39.9) | |
| class III obesity (≥ 40.0) |
On this page:

Holly is a doctor of osteopathic medicine and board-certified physician. She holds a Bachelor's in dietetics and is also an NASM certified personal trainer.

Elise is a registered dietitian with a Master's degree in nutritional sciences and founder of The Flourished Table, an online nutrition coaching and consulting business.
How to Calculate BMI
Body mass index, or BMI, is one of the most widely used metrics to measure health status. It is quick and easy to calculate to estimate one’s weight status based on their height.
BMI Formula
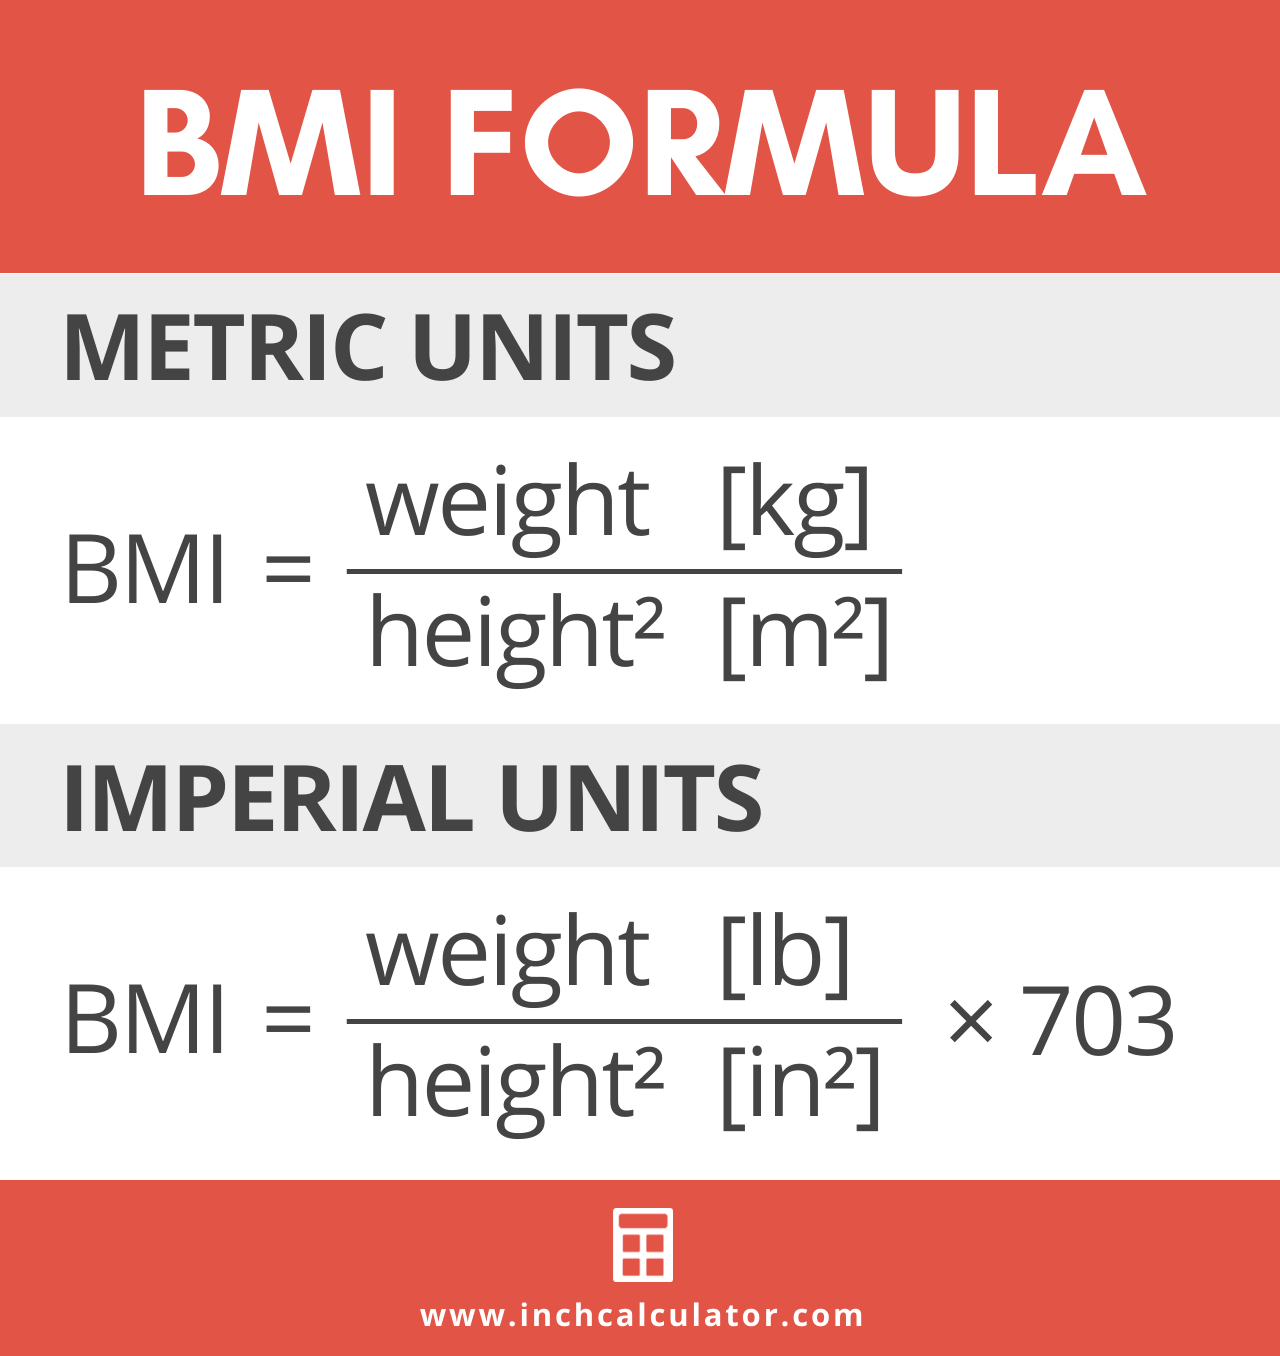
To calculate your body mass index, you only need to know your current height and weight. The formula for BMI is:
BMI = weight [kg] / height² [m²]
Imperial Units
BMI = weight [lb] / height² [in²] × 703
Or simply use the calculator above and it will do the work for you!
Body Mass Index Categories
Once you calculate your BMI, you can then see where this falls on a body mass index chart such as the one below.
Studies have found that BMI is correlated with body fat and disease risk; therefore, BMI ranges are broken down into categories to estimate your nutritional status.[2]
These categories are: underweight, healthy weight, overweight, and obese.[3] Obesity can further be broken down into class 1, class 2, and class 3 (or severe) obesity.
These ranges for BMI are based on the fact that excess body fat and obesity increases the risk of chronic diseases and premature death.
For example, being overweight or obese significantly increase the risk of heart disease, hypertension, and diabetes in both men and women. These diseases all subsequently increase morbidity and premature death.
BMI Chart
| Weight Category | BMI |
|---|---|
| Underweight | <18.5 |
| Healthy Weight | 18.5 – 24.9 |
| Overweight | 25 – 29.9 |
| Class 1 Obesity | 30 – <35 |
| Class 2 Obesity | 35 – <40 |
| Class 3 Obesity | >40 |
Is Body Mass Index Accurate?
While the BMI formula is a quick way to estimate health status and disease risk, it is not without fault. Since it only takes height and weight into consideration, it is not the perfect model for all individuals.
In addition, it does not directly measure body fat. As with all health calculations, it is an estimate and has limitations.[4]
For instance, bodybuilders and athletes may have a higher body weight. However, this is due to increased lean muscle mass and not fat mass (or adiposity).
Calculating their BMI would give a false impression that they are overweight or obese. Therefore, you have to take into account individual circumstances when using body mass index calculations.
The BMI tends to be a better predictor of body fat in individuals with higher levels of BMI. For instance, a person with a BMI above 35 or 40 is more likely obese. These extremely high numbers are less likely due to increased lean muscle mass.
How to Calculate BMI for Kids
BMI can also be used for young children and adolescents. While the same formula is used, the value is interpreted differently than an adult body mass index.
For adults, BMI categories are the same regardless of age or sex. However, in young children and teenagers, it’s age and sex-specific.
This is because body fat norms change with age and also differs between young boys and girls based on hormonal fluctuation.
As an example, a 7-year-old boy with a BMI of 20 would fall into the greater than 95th percentile and would be considered obese.
However, a 15-year-old boy with a BMI of 20 would fall between the 25th and 50th percentile and would be considered to be a healthy weight. These BMI charts can be accessed through the CDC website (boys[5] and girls[6]).
Body mass index for-age growth charts from the CDC take into account these differences and show BMI as a percentile ranking rather than falling into underweight, healthy weight, or obese categories. These percentiles are determined using data collected from surveys of children from the U.S. population from 1963-1980 and 1988 to 2016.[7]
Categories for Children Ages 2-19
| Weight Category | Charting Percentile |
|---|---|
| Underweight | <5th percentile |
| Healthy Weight | 5th to <85th percentile |
| Overweight | 85th to <95th percentile |
| Obese | >95th percentile |
BMI charting in kids is a useful way to recognize disruptions in a child’s growth. In fact, one study from the Journal of Pediatrics found that pediatricians that utilized BMI charting had a greater recognition of weight problems in children compared to using height and weight charting alone.[9]
BMI in Men and Women
The BMI formula is the same for both adult men and women. However, men and women with the same body mass index can still have differing levels of body fat. In general, women tend to have more body fat than men due to differing hormone levels and physiology.
The BMI can also be used to help calculate an ideal body weight (IBW) for both men and women. In the past, separate equations for men and women have been used to determine IBW based on height. A commonly used equation for IBW is:
IBW Men [lbs] = 106 + 6 × (height [inches] – 60)
IBW Women [lbs] = 100 + 5 × (height [inches] – 60)
So, in this case, the ideal body weight for a 5′ 5″ woman would be 125 pounds, while the ideal body weight for a 5′ 5″ male would be 136 pounds.
However, a 2016 study found that using a target BMI in the IBW equation gives a more accurate representation of ideal body weight. This also replaces using two separate equations for men and women by adopting one universal equation.[10]
IBW [lbs] = 5 × BMI + ((BMI ÷ 5) × (height [inches] – 60))
This equation allows you to target a BMI and convert this to an ideal weight in pounds. Studies have found that a BMI around 22 confers the lowest morbidity in both men and women.[11] So using this formula, a 5′ 5″ woman targeting a healthy BMI of 22 would have an ideal body weight of 132 pounds.
Similarly to BMI, the ideal body weight formula has limitations. The equation fails to consider genetics, environment, and lifestyle, all of which should be a factor when determining one’s ideal body weight.
Only One Aspect of Overall Health
As with all anthropometric calculations, BMI is only an estimate of body fat and health status. This calculation should not be used on its own to determine overall fitness or disease risk.
Age, sex, physical activity, lean muscle mass, waist circumference, genetics, and overall body composition can be used together with BMI to help form a complete picture of your health and fitness.
Another commonly used anthropometric measurement is the waist-to-height ratio.
Similar Health Calculators
References
- World Health Organization, A healthy lifestyle - WHO recommendations, https://www.who.int/europe/news-room/fact-sheets/item/a-healthy-lifestyle---who-recommendations
- Garrow, J. S., & Webster, J., Quetelet's index (W/H2) as a measure of fatness, International journal of obesity, 1985, 9(2), 147-153. https://europepmc.org/article/med/4030199
- Centers for Disease Control and Prevention, Adult BMI Categories, https://www.cdc.gov/bmi/adult-calculator/bmi-categories.html
- Prentice, A. M., & Jebb, S. A., Beyond body mass index, Obesity reviews, 2001, 2(3), 141-147. https://onlinelibrary.wiley.com/doi/abs/10.1046/j.1467-789x.2001.00031.x
- Centers for Disease Control and Prevention, Boys: Ages 2–20 years - Body mass index-for-age percentiles, https://www.cdc.gov/growthcharts/data/extended-bmi/BMI-Age-percentiles-BOYS.pdf
- Centers for Disease Control and Prevention, Girls: Ages 2–20 years - Body mass index-for-age percentiles, https://www.cdc.gov/growthcharts/data/extended-bmi/BMI-Age-percentiles-GIRLS.pdf
- Centers for Disease Control and Prevention, CDC Extended BMI-for-age Growth Charts, https://www.cdc.gov/growthcharts/extended-bmi.htm
- Centers for Disease Control and Prevention, Child and Teen BMI Categories, https://www.cdc.gov/bmi/child-teen-calculator/bmi-categories.html
- Perrin, E. M., Flower, K. B., & Ammerman, A. S., Body mass index charts: useful yet underused, The Journal of pediatrics, 2004, 144(4), 455-460. https://www.sciencedirect.com/science/article/abs/pii/S0022347604000927
- Peterson, C. M., Thomas, D. M., Blackburn, G. L., & Heymsfield, S. B., Universal equation for estimating ideal body weight and body weight at any BMI, The American journal of clinical nutrition, 2016, 103(5), 1197-1203. https://pubmed.ncbi.nlm.nih.gov/27030535/
- Tokunaga, K., Matsuzawa, Y., Kotani, K., Keno, Y., Kobatake, T., Fujioka, S., & Tarui, S., Ideal body weight estimated from the body mass index with the lowest morbidity, International journal of obesity, 1991, 15(1), 1-5. https://europepmc.org/article/med/2010254